In my previous post I talked about how we may see a return of the risk parity portfolio this year as tech stocks, bonds, and gold all go up at the same time. As I’ve observed the market unfold this week, I realized that I’m too early on that call, as the looming impact of the post debt-ceiling Treasury issuance is already having an outsized effect on yields, USD, and equities. I recommend reading this Bloomberg article to get a picture of what will be the biggest flood of Treasury issuance within a short span of time. The Treasury announced their borrowing projections to be north of $1.3T until the end of the 3rd quarter, which telegraphs to the world that they need to conduct the biggest sale of Tbills and notes the world has ever seen in a such a short period of time. Expectations of the issuance have resulted in an aggressive stagflation regime, where the Treasury curve has bear flattened, USD has rebounded, and equities have reversed sharply off their highs.
As T-bill supply hits the market, it removes bank reserves from the system as that money used to purchase the supply has to come from somewhere. That money leaves the banking system and enters the Treasury General Account (TGA), which needs to be refilled from almost zero back to a healthy $550-600B (plus about $175B in outlays that will be spent right away in the first half of June). Remember my chart of net liquidity, which equals the Fed balance sheet minus capital in the TGA and the reverse repo facility (RRP). If the TGA is going up by $550-600B, that means net liquidity is going down by that much, sending net liquidity back to the Jan lows.
Typically, a withdrawal of liquidity doesn’t have as much market impact on yields, but based on what I’m seeing, this time is different. It’s hard to find any other credible explanation for why Treasuries have decided to break through the bottom of the range despite concerns over a recession and a debt-ceiling impasse. The only explanation I can come up with is that buyers are on strike until yields reach an attractive enough level for the market to absorb the $1T+ in Treasury supply. This time, supply/demand dynamics > fundamentals.
What I got wrong in my last post was that I expected the market impact of the issuance to come later, after the debt ceiling was lifted. I didn’t expect the market to be front-running the issuance a full two weeks prior to the x-date of June 1. The buyer strike is underway as we speak, and the second and third order effects will create some volatility over the coming weeks.
The fragile banking system is unlikely to withstand such a violent withdrawal of liquidity alongside a surge in nominal and real yields. Recall this chart of real 10 yr yields, which shows that whenever real yields reach 1.60%, things break. This time, it could be a super-regional bank with $300-500B in deposits, or a major European bank.
We are likely on the downslope portion of a V-shaped dip in risk assets. The sharp part of the V happens when something bad happens to the financial plumbing, and then you get a sharp recovery reminiscent of March once the Fed steps in and fixes the problem with its balance sheet. It is on the upsloping portion of the V when I intend to get back into the long Nasdaq/gold/Treasury portfolio. By then, it will be clear to the market that the Fed is unable to shrink its balance sheet any further without setting another bank on fire, and the Fed put will be back once again.
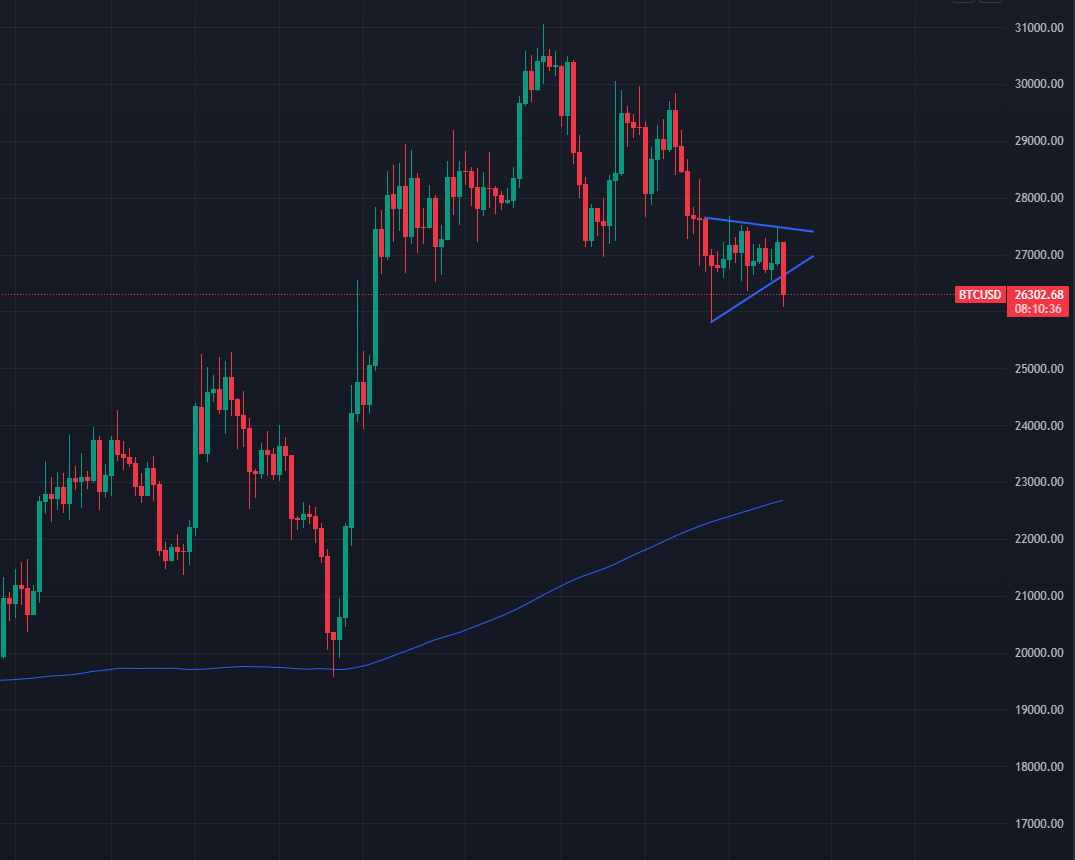
As usual, I try to make money no matter what the market is doing, so I’m shorting the assets that will be most negatively impacted by the withdrawal of liquidity. The first short candidate is BTC/USD, which I sold today at around current levels on this chart below. My target is the 200 day moving average in blue. BTC is highly sensitive to liquidity and has been trading weakly relative to other risk assets, making it an attractive tactical short.
Short candidate #2 is KRE. While it is a popular speculative vehicle right now for shorts, the recent squeeze has made positioning cleaner. I’m sizing this one smaller because the likelihood of getting squeezed out of the position is higher than BTC.
Disclaimer: The content of this blog is provided for informational and educational purposes only and should not be construed as professional financial advice, investment recommendations, or a solicitation to buy or sell any securities or instruments. The blog is not a trade signaling service and the author strongly discourages readers from following his trades without experience and doing research on those markets. The author of this blog is not a registered investment advisor or financial planner. The information presented on this blog is based on personal research and experience, and should not be considered as personalized investment advice. Any investment or trading decisions you make based on the content of this blog are at your own risk. Past performance is not indicative of future results. All investments carry the risk of loss, and there is no guarantee that any trade or strategy discussed in this blog will be profitable or suitable for your specific situation. The author of this blog disclaims any and all liability relating to any actions taken or not taken based on the content of this blog. The author of this blog is not responsible for any losses, damages, or liabilities that may arise from the use or misuse of the information provided.


Hi Geo... good stuff as usual, but BTC is going to climb before the liquidity scenario you envisioned. Are you going in too early?