A key feature of the market over recent years is the constant conflicting signals about the direction of the global economy, confusing traders and making it difficult to position for ever-shifting fundamentals. A month ago I highlighted how US data was clearly weakening, yet yields rebounded and commodities continued in its bull market, both of which are inconsistent with a growth slowdown. SPX continues to grind higher, defying the expectations of both the recession doomers and the high-for-longer crowd.
The past week has relieved some of the cognitive dissonance that has plagued us global macro traders. Economic data has continued to surprise to the downside as I expected, while yields have sold off and commodities have fallen back to earth. Even the Japanese yen has revived some of its safe haven tendencies by rebounding off last week’s lows. Most asset classes are moving in tandem to price in a growth slowdown, which gives me confidence that we are moving into a different regime and market environment. Whereas previously we were flipping back and forth between stagflation (high inflation, declining growth) and disinflation (low inflation and rising growth), I believe we are now oscillating between a disinflation regime and a recession regime (low inflation and declining growth).
The economic data has been convincingly bad. Chicago PMI last Friday dropped to levels only seen in previous recessions:
ISM manufacturing headline index and new orders are in contraction territory, near the levels we saw in late 2022/early 2023.
JOLTS data surprised to the downside and points to softening employment and wages ahead.
Last month we also saw non-farm payrolls, retail sales, and PCE inflation all come in weaker than expected, along with downward revisions. In the next two weeks we will see another set of employment and inflation data, along with the Federal Reserve meeting where Powell will need to address the weakening data and signal how they plan to respond.
Meanwhile, WTI oil is showing signs of slowing demand for oil, despite OPEC’s efforts to keep supply stable. This weekend’s meeting hinted that OPEC has reached the limit of how much they can restrict supply to prop up prices.
Even copper, the darling of this year’s commodity bull run, has topped out. Commitment of traders reports show that speculators are heavily long while commercials are heavily short. Given how growth is slowing down rapidly, I wouldn’t be surprised if copper gives up all of its gains this year. Don’t believe the hype about AI and electrification being bullish for copper - this is simply a narrative that gets louder as price goes up and softer as price goes down. It certainly won’t save longs from getting washed out on this reversal.

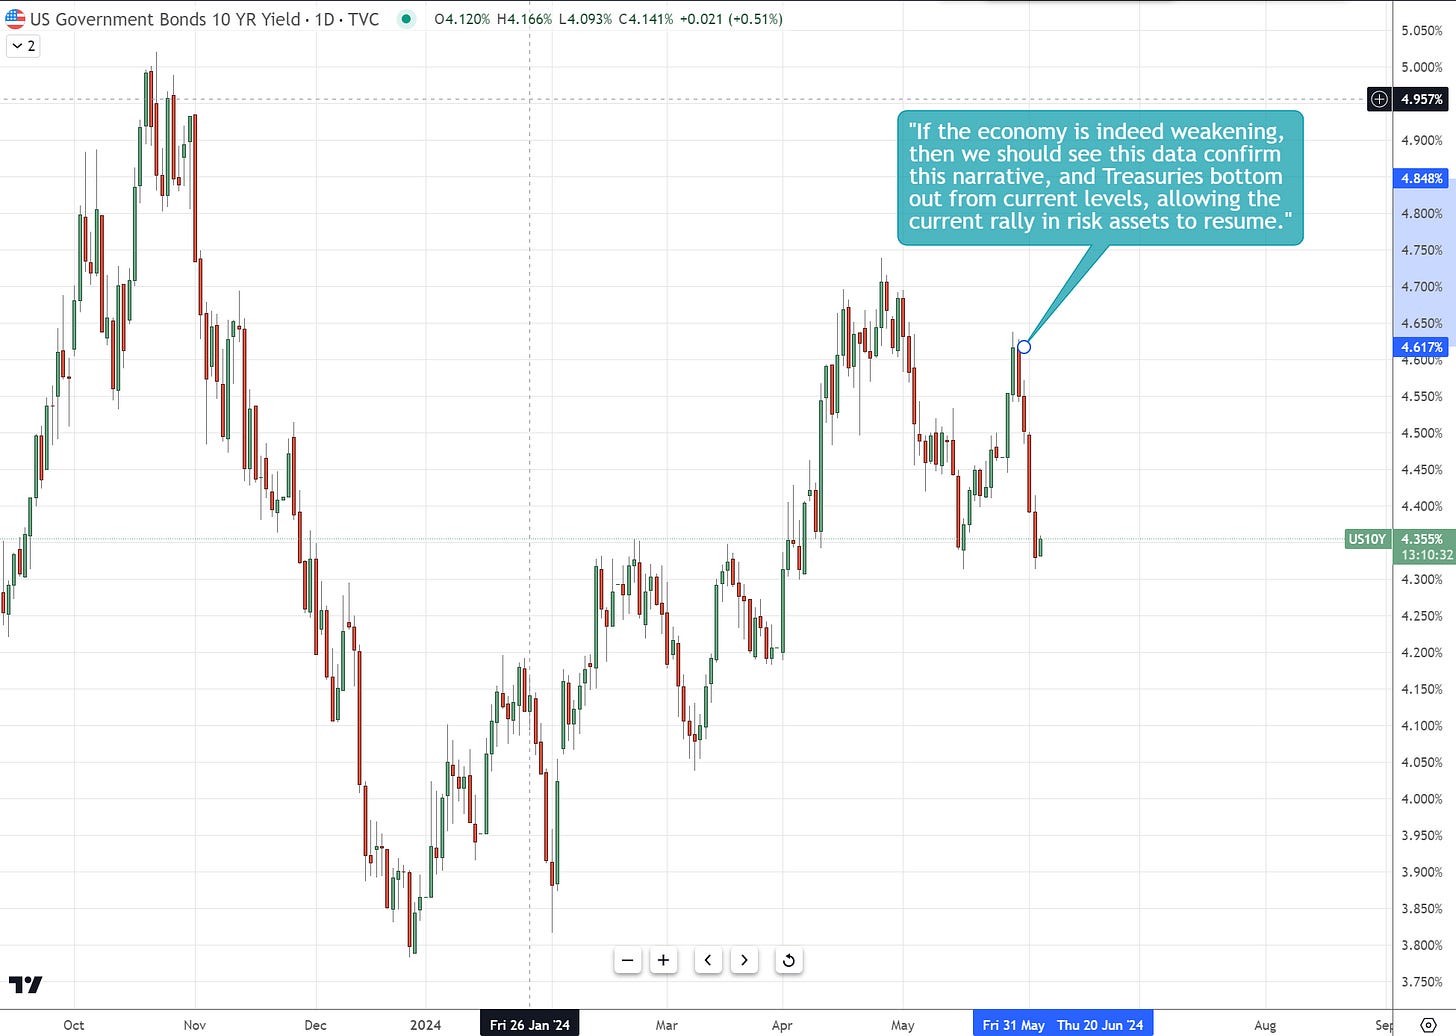
I highlighted last week that global bonds would find a bottom, and that has played out nicely.
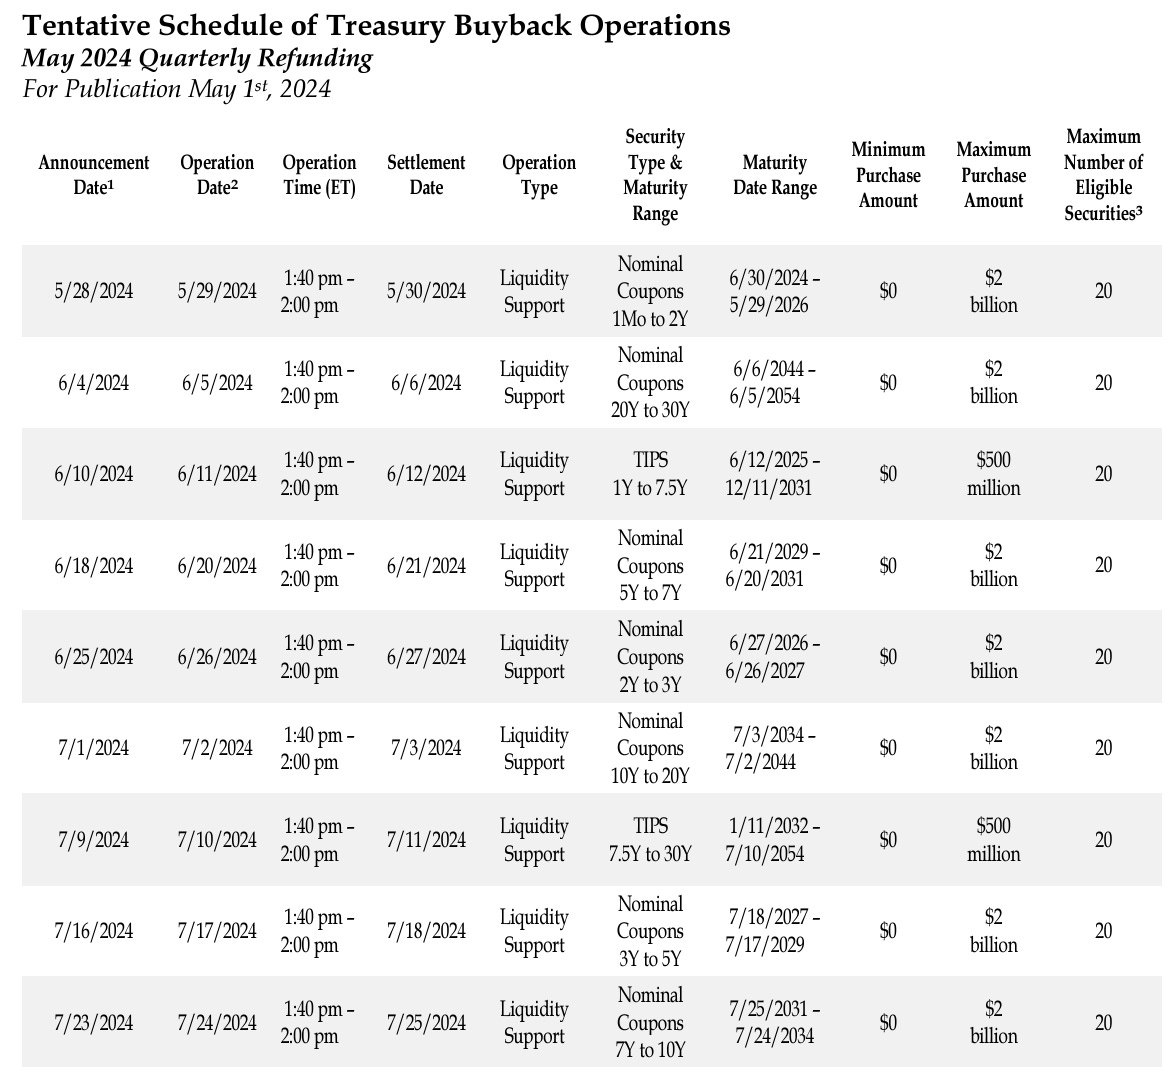
I forgot to mention that the Treasury started its buyback program last week, where they will be purchasing $15b of coupons and notes over the next two months. These buybacks will be funded with additional Tbill issuance, which has little impact on liquidity. In essence, the Treasury is selling Tbills which have negligible impact on financial conditions to purchase notes and coupons that have a high impact on the supply/demand balance in notes and coupons. This is just one of the many tools the Treasury has to keep liquidity flowing and prevent a bond market meltdown, and I wouldn’t be surprised to see this buyback program increase in size over time.
The clear trade amidst all this is to bet on lower yields - both in the short end via SOFR futures and in mid-curve Treasuries. This trade wins in both disinflation and recession regimes. In last week’s paid subscriber section I talked about going long SOFR Sep 2025 futures when they were roughly 23 bp lower from today’s price. This trade has a lot more to go, as the market is only pricing a 75% chance of a cut in September, and 120 bp of total cuts by the end of next year. If employment and growth were to deteriorate rapidly over the next 1-2 months, I believe the Fed will cut 50 bp by September (either 25 in July and 25 in Sept, or 50 bp in Sept) and at least 200 bp by the end of next year.
The debate in the global macro community is what this all means for risky assets. Is bad data bad for stocks because earnings will take a hit, or is it good for stocks because it will prompt the Fed to cut rates? Currently the market is trading like it’s confused. SPX sold off on last Friday’s weak Chicago PMI, but then squeezed violently into the close. It also sold off on the weak ISM, but once again recovered.
Ultimately I believe that prices for risk assets will resolve to the upside, but that view is contingent on a Fed that signals a willingness to cut in response to a weakening economy. For now, the market is uncertain about the timing and aggressiveness of the Fed’s first cut, which is why the bond market is cautiously pricing cuts further out in the curve instead of the front. As a result, the 2-10s Treasury curve has defied expectations by bull flattening since last Thursday.
This makes the FOMC meeting on June 12 a pivotal moment for the market, as it will give the market clarity on how soon and how aggressive the start of the rate cut cycle will be. A dovish Fed will result in the short end of the curve leading the move (a bull steepening) and give the equity and crypto markets confidence that the Fed put remains intact.
Disclaimer: The content of this blog is provided for informational and educational purposes only and should not be construed as professional financial advice, investment recommendations, or a solicitation to buy or sell any securities or instruments. The blog is not a trade signaling service and the author strongly discourages readers from following his trades without experience and doing research on those markets. The author of this blog is not a registered investment advisor or financial planner. The information presented on this blog is based on personal research and experience, and should not be considered as personalized investment advice. Any investment or trading decisions you make based on the content of this blog are at your own risk. Past performance is not indicative of future results. All investments carry the risk of loss, and there is no guarantee that any trade or strategy discussed in this blog will be profitable or suitable for your specific situation. The author of this blog disclaims any and all liability relating to any actions taken or not taken based on the content of this blog. The author of this blog is not responsible for any losses, damages, or liabilities that may arise from the use or misuse of the information provided.


"Ultimately I believe that prices for risk assets will resolve to the upside, but that view is contingent on a Fed that signals a willingness to cut in response to a weakening economy."
Amazing how hard it is to kill this stock bull market since 2009. You wonder, what will it ever take to get stocks to crash and stay down like busts in the past? Some say lots more white collar layoffs, which could interrupt the passive 401k flows into "buy and hold total market index etf's".
I've personally got caught in a lot of "recency bias" this cycle starting in 2009 post gfc. Being a gen-xer I got out of college during the early 90's recession, which was a decent recession where it was hard to find a job and house prices went down slowly from 1990-1997. Then in my late 20's the dotcom bust was a massive wash out of course. 80% crash nasdaq & >50% S&P, and it didn't recover right away (like market did in 2020 and 2022 corrections). Then of course the GFC which was another massive bust which did not recover to break even for years.
So as a Gen-Xer I have this mental baggage of going though 3 bad recessions. But post GFC has been a very different world. 15 years now without a normal biz cycle downturn. Valuations do not matter anymore in stocks, they just get a relentless bid. Residential housing is basically in a 12 year bull market. So its a very strange world from the past. Analysts state many reasons for this new world we have all heard.... from the Fed support, more fiscal, the 401k passive index bid (which was nowhere as big in 2000 and 2008 and non existent in 1990), tech companies with higher profit margins and lower capex than companies of the past. Recessions getting shorter and rarer b/c US economy is less reliant on cyclical industries like AG & manufacturing and more service oriented. Wage increases are fueling this economy vs. consumer credit in prior cycles. Etc.....
Hey! When you say that the market is pricing-in a 75% chance of a rate cut, how is that determined? What method is used to calculate if an event is priced-in? Thanks!