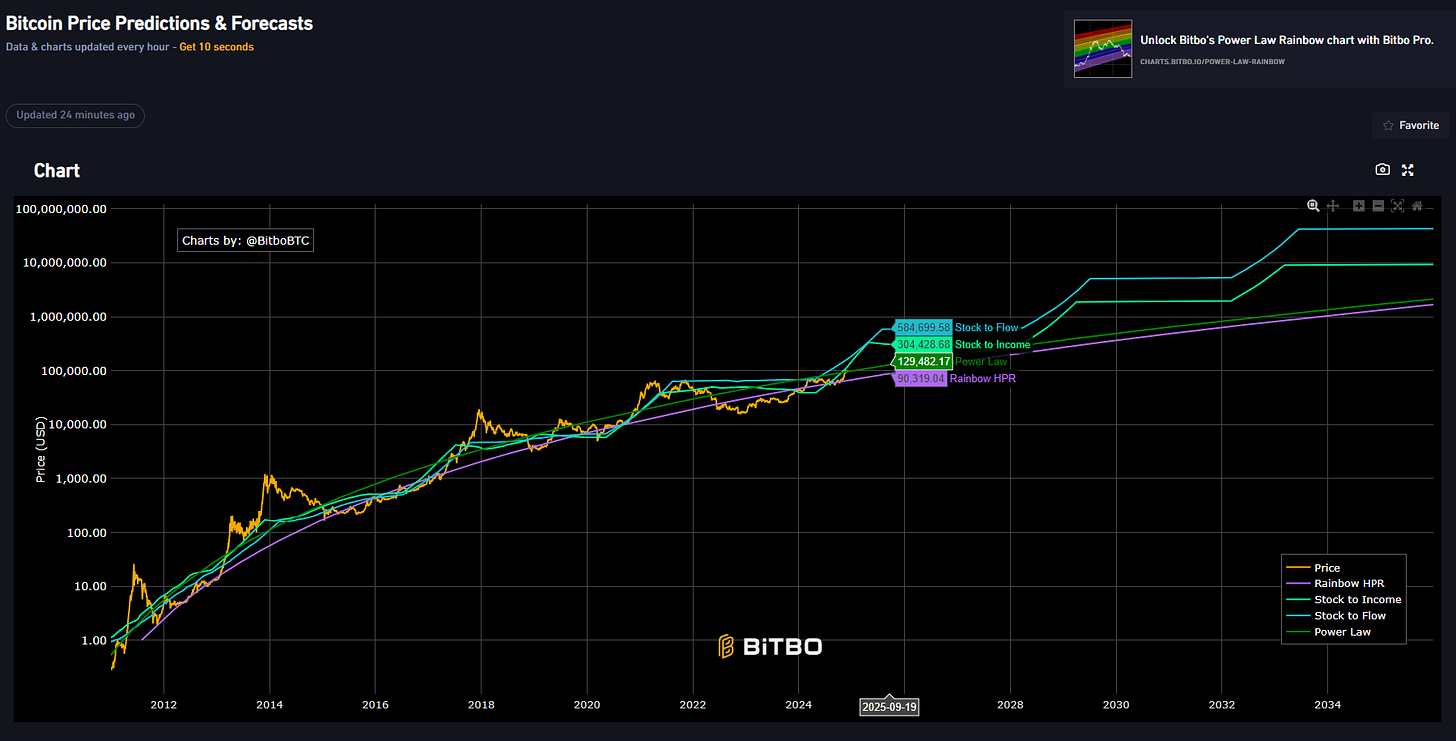
A friend of mine was asking for advice on a crypto exit strategy, and it just so happened that I’ve been wanting to write about this exact thing. In addition to the tactical trading I do in the Fidenza Macro portfolio (which is shared in real-time to paid subscribers), I also have some long term holdings in BTC and other coins that I plan to hold until the end of the current cycle. I believe we are now into the second half of the crypto bull market, so it’s important to have an exit strategy in place. At the top of the market, everyone is bullish and the market always feels like it can continue going higher. It is easy to be blind to the signals that the market is forming a top, which is why a well-laid strategy written beforehand can be a good reminder to take some profits.
This strategy comes with a few assumptions:
This current bull market will end at some point like previous bull markets and turn into a bear market.
Attempting to sell at the peak of a bull market and buying back in during a bear market is preferable to HODLing through the ups and downs.
Acting on these assumptions served me well in the 2017 and 2021 cycles. If you don’t believe in these assumptions, then good luck and I wish you the best. As always, paid subscribers will be the first to know when I reduce my exposure based on the following methodology.
Scaling your exits
It’s impossible to know exactly when and at what price the high will occur for every coin that you own. It’s also possible that alts will continue rising for months after BTC has topped, which has been the case in previous cycles. Therefore, I plan to sell a third of my holdings when we’ve reached the minimum price and time targets for the coins that I own, another third when things have gotten crazy and most top signals on my checklist are getting ticked, and the remainder after a sharp reversal has occurred after a parabolic rally.
Price targets
A variety of models that predict BTC price targets based on cycle analysis produces a range of price targets. I found a good charting tool that provides a way to visualize these targets based on models such as Power Law, Stock to flow, HPR Rainbow, etc. Some of these models produce price targets of $500k and more, which I personally find way too ambitious.
I am more conservative, and work under the assumption that the multiple from this cycle’s high to last cycle’s high of $69k will not exceed the high-to high multiple from 2018 to 2021 of 250%. Based on that assumption, my upper target for BTC this cycle is $244k, and I will have sold 2/3 of my BTC if we reach that level.
Why so conservative relative to these models? With each cycle, BTC matures as an asset class, and the entrance of tradfi capital should result in lower volatility and smaller overshoots to the upside and downside over time. A right-tail exception to this rule would be if the US government establishes a Bitcoin Strategic Reserve and commits to buying a significant amount of BTC every year. This, however, is not a base case scenario for me, and I’ll write more on that later.
Time projections
I use two ways to measure time targets - the average duration from low to high from the previous two cycles (2018 and 2021), and the average high-to-high from the previous two cycles. The average high to high from the previous two cycles was 207 weeks, while the average low to high was 137 weeks. If we project the duration from low to high from previous cycles, it projects the high of this cycle will occur in July 2025.

If we project the average duration from high-to-high from the previous two cycles of 207 weeks to the current cycle, then the high should occur in late Oct 2025.
These projections align with the stock-to-flow model (the blue line in the first chart), which shows the price projection kinking lower in July 2025. In fact, most cycle projections I’ve seen peg the high for the current cycle to occur sometime in Q3 or Q4 2025.
Projections don’t always work
Projections and cycle analysis are not a crystal ball and don’t predict the future. For example, the 2021 was a messy double top where BTC dropped 55% before rebounding to an all time high, but only surpassing the previous top by $4k. Price could undershoot or overshoot my price and time targets by a large margin. What if we get a black swan risk-off event (such as Trump getting assassinated)? This would prematurely end the cycle well before any price or time projections are reached.
I have a checklist of crypto top indicators as an alternative to my projections above. As items on this checklist get ticked off, I will start selling that first third of my exposure. By the time all items get ticked off, I should be out of at least 2/3 of my exposure.
My Crypto Market Top Checklist
Keep reading with a 7-day free trial
Subscribe to Fidenza Macro to keep reading this post and get 7 days of free access to the full post archives.


