We are exiting the quiet, choppy summer period, and there are some interesting chart patterns forming or completing that point the way for where we will be heading for the rest of the year. It just so happens that these patterns confirm the fundamental views I’ve been repeating on my blog, which is that elevated inflation will result in short term interest rates continuing higher, equities trading to new lows on the year, and a higher US dollar.
Before we begin, I have a favor to ask. I get joy from sharing my ideas and writing about my trading experiences, but it would be even more meaningful if I could reach more readers. If you’ve been finding my writing educational and useful for your trading and investing process, please pay it forward by sharing my blog on social media or directly to friends and colleagues. If you’re reading this and haven’t subscribed yet, please enter your email to subscribe. Don’t forget to follow my Twitter account, where I post charts, news, and analysis on an ongoing basis. Thank you in advance! Now on to the good stuff.
The S&P 500 is stalling at a confluence of resistance levels - the 200 day moving average at 4316 (in the previous bear markets of 2001 and 2008, this has successfully capped rallies), the 61.8% Fibonacci retracement at 4362, and a trendline going back to Jan 2022 at 4323. I am long via puts, funded by selling small clips of short dated calls.
A concentration of strikes is pinning SPX here but after they expire on tonight’s option expiry, volatility may expand.
Courtesy: Piper Sandler
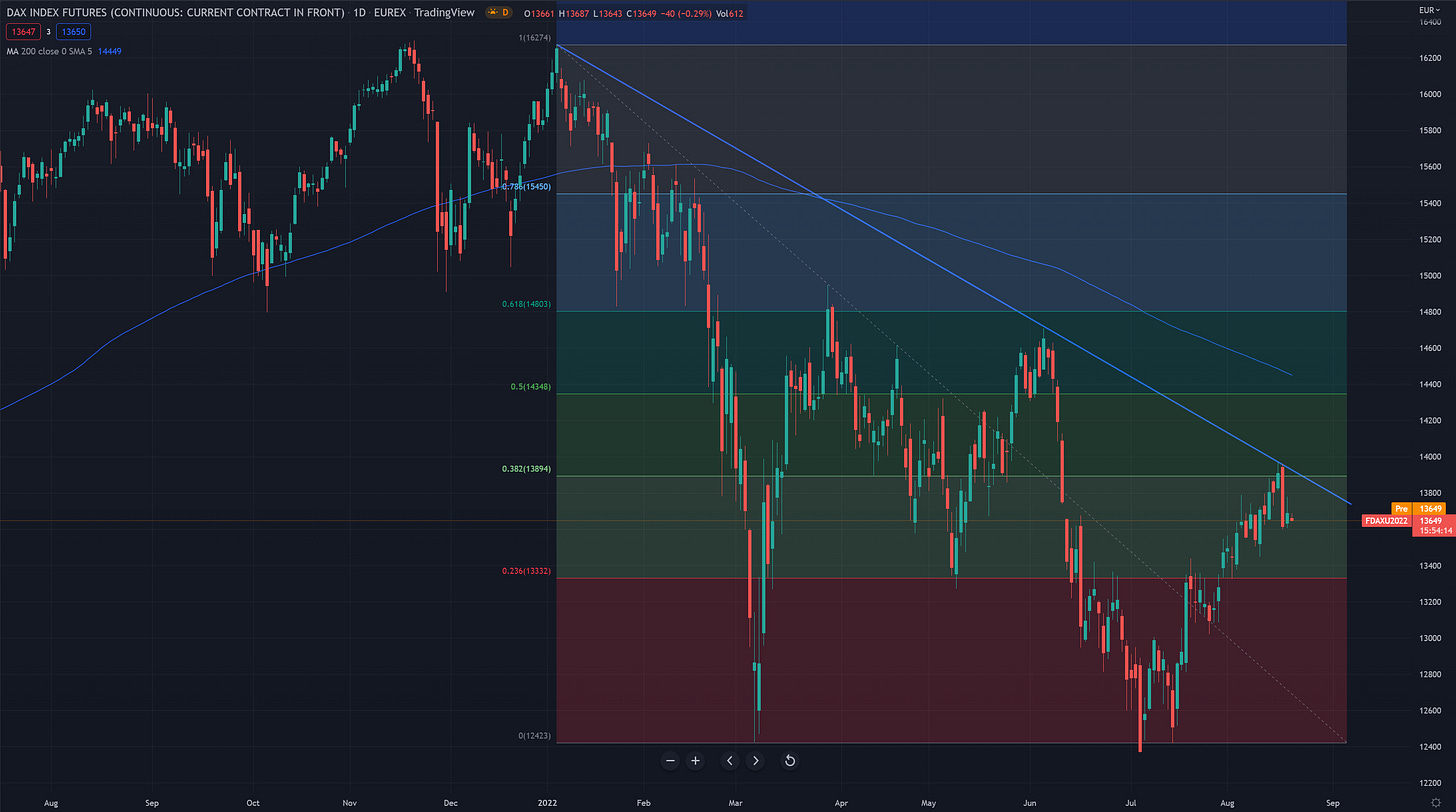
I also shorted the German DAX this week. There is a confluence of a daily trendline and the 38.2% Fibonacci retracement capping this rally. The European equity market seems to have forgotten that there is an energy crisis in progress that will likely get worse during the winter. Germany is being asked to ration energy and it’s likely that manufacturing will slow to a crawl as natural gas is saved for the average citizen to heat his home.
We are breaking out of a continuation pattern in 2 yr Treasury yields. They have already reversed the selloff after the lower than expected CPI print, and Fed officials have come out in droves maintaining the message that inflation is still a concern, they are not ready to pivot, and tightening will continue. Labor market and retail sales data have been too robust for the economy to enter a disinflationary regime. The Fed is losing the game of convincing the market that it’s serious about tightening financial conditions, as evidenced by the recent pump in meme stocks like Bed Bath and Beyond. All it takes is for the next inflation print to beat expectations, and the conversation will shift to the Fed hiking rates to 4.5-5%. I’m expressing this view via short Eurodollar June 2023 contracts.
Eur/usd ran into resistance (previous support) at 1.0350, as well as a trendline going back to Feb 2022. The rally on the recent CPI miss was a bull trap, and now we are breaking below support from the recent congestion zone. This bearish setup is confirming today as I write. I’m short spot eur/usd.
Usd/cnh broke above ascending triangle resistance of 6.7880, retested that level, and is now making new highs since May. The last level of resistance is the May 13 high of 6.8380, and then it’s clear sky until 7.20 (the highs from 2020). The fundamental picture in China still looks bleak as they muddle through the dual crises of zero covid policy and a deleveraging of the real estate market. They are loosening liquidity, but more needs to be done. The continued easing of monetary conditions should be the driver for further CNH weakness.
Bitcoin is breaking down from a rising wedge pattern. In the larger context of this bear market, it has been a really feeble rally and wasn’t even able to retest previous support at 28-30k. I’ve mentioned in previous Twitter posts that I’m long term bullish crypto, but right now I’m short term bearish.
Ethereum has performed much better than Bitcoin thanks to confirmation of the merge, which will happen around Sep 15. Those who want to dig deep into the merge and strategies around trading it can check out this Bankless article. The bullish thesis of the merge is that the daily supply of ETH rewarded to proof-of-work miners will drop by around 90% when ETH transforms into a proof-of-stake blockchain. A lot of longs have piled in expecting a further price rise after the merge, because it’s the equivalent of 2-3 bitcoin halvenings (previous bitcoin bull markets were preceded by halvenings that cut miner supply in half). What novice traders don’t realize is that the massive amount of long positions in ETH are a larger and more threatening source of supply that could send price lower as the market sells the event. There is a confluence of resistance above current levels (previous support at 2160, the 200 day moving average and a daily trendline at 2230) so price spikes into the merge should be sold.
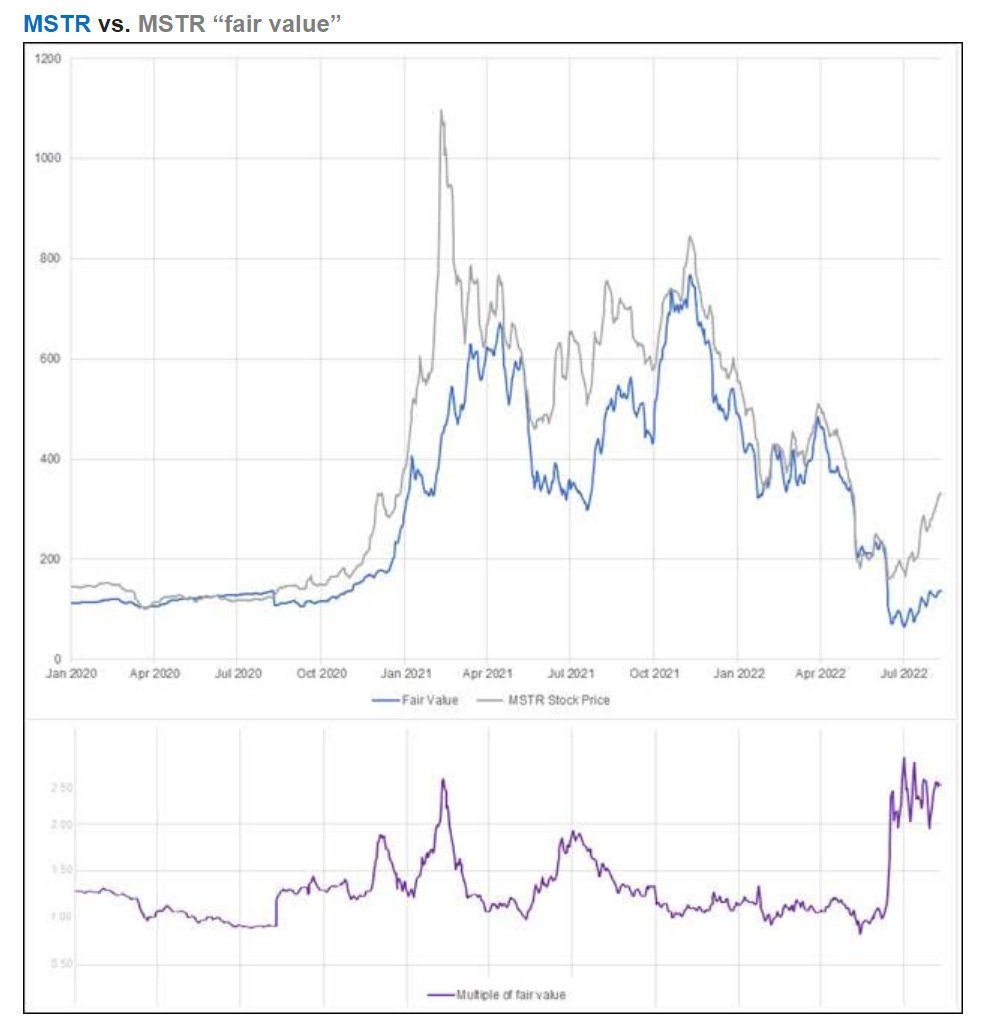
If you want to be short crypto, a better risk/reward way to get short exposure is by shorting Microstrategy. The majority of MSTR’s value is derived from the bitcoin on its balance sheet, but the stock’s price also swings wildly around that fair value estimate. Brent Donnelly shared a chart of price vs fair value in a recent blog, and we are near all time highs.
If bitcoin revisits the lows of 18k and the equity bear market resumes, we should see MSTR revisit $150 from its current level of $324
Other positions
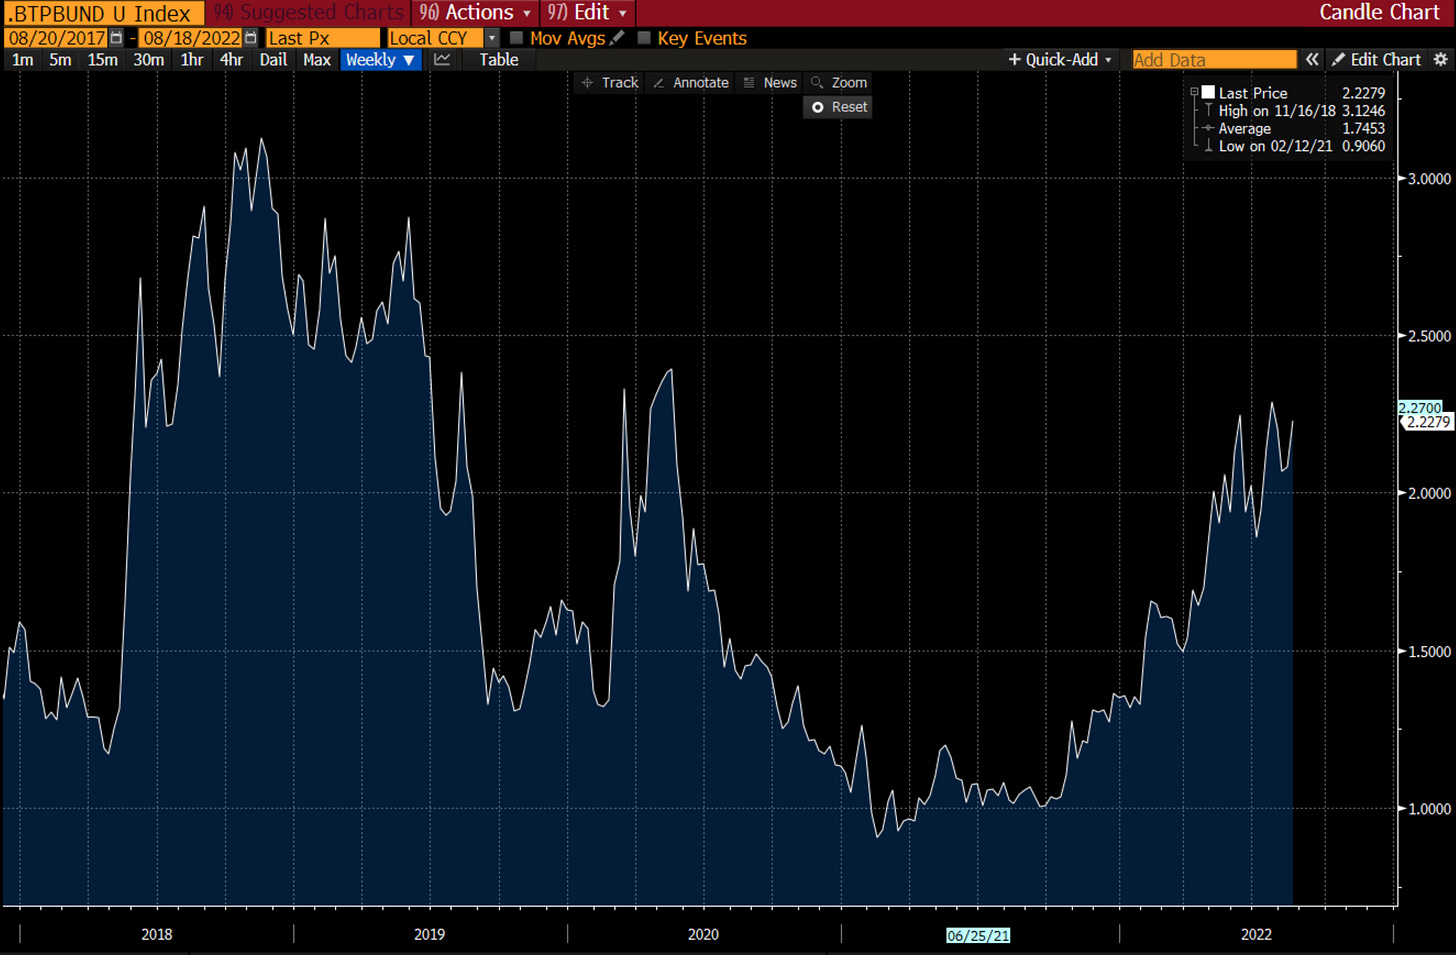
I stopped out of long soybeans and long gasoline for small losses. I am, however, still long Henry Hub natural gas. I have a widener in the Italian BTP/German Bund government bond spread, which is current at 2.22%. During the Fed QT cycle of 2018, it got up to 3.12%. Since this is a much more aggressive tightening cycle and the EU faces an even deeper recession this year, I don’t see why we can’t revisit those wide levels again. I think we are far from levels where the ECB will step in to support Italian bonds.
One last thing - In my long term book I’m accumulating gold below 1800. I know this goes against my long USD, tighter Fed view, but it’s really a hedge against two scenarios - 1) I’m wrong and the Fed is not as committed as I believe in bringing down inflation, or if something happens that forces them to stop 2) Things getting scarier between US and China. A US-China conflict would put a stop to Fed tightening, and both economies would enter a wartime money printing inflationary regime that would send gold soaring by multiples of today’s values.
Disclaimer:
The content of this blog is provided for informational and educational purposes only and should not be construed as professional financial advice, investment recommendations, or a solicitation to buy or sell any securities or instruments.
The author of this blog is not a registered investment advisor, financial planner, or tax professional. The information presented on this blog is based on personal research and experience, and should not be considered as personalized investment advice. Any investment or trading decisions you make based on the content of this blog are at your own risk.
Past performance is not indicative of future results. All investments carry the risk of loss, and there is no guarantee that any trade or strategy discussed in this blog will be profitable or suitable for your specific situation. The author of this blog disclaims any and all liability relating to any actions taken or not taken based on the content of this blog. The author of this blog is not responsible for any losses, damages, or liabilities that may arise from the use or misuse of the information provided.


Thanks for the shout !
i bought also long Henry Hub natural gas. but i bought a lot of boil at 20$ it fall like knife i can not look at it but why did you buy it i want to feel comfortable