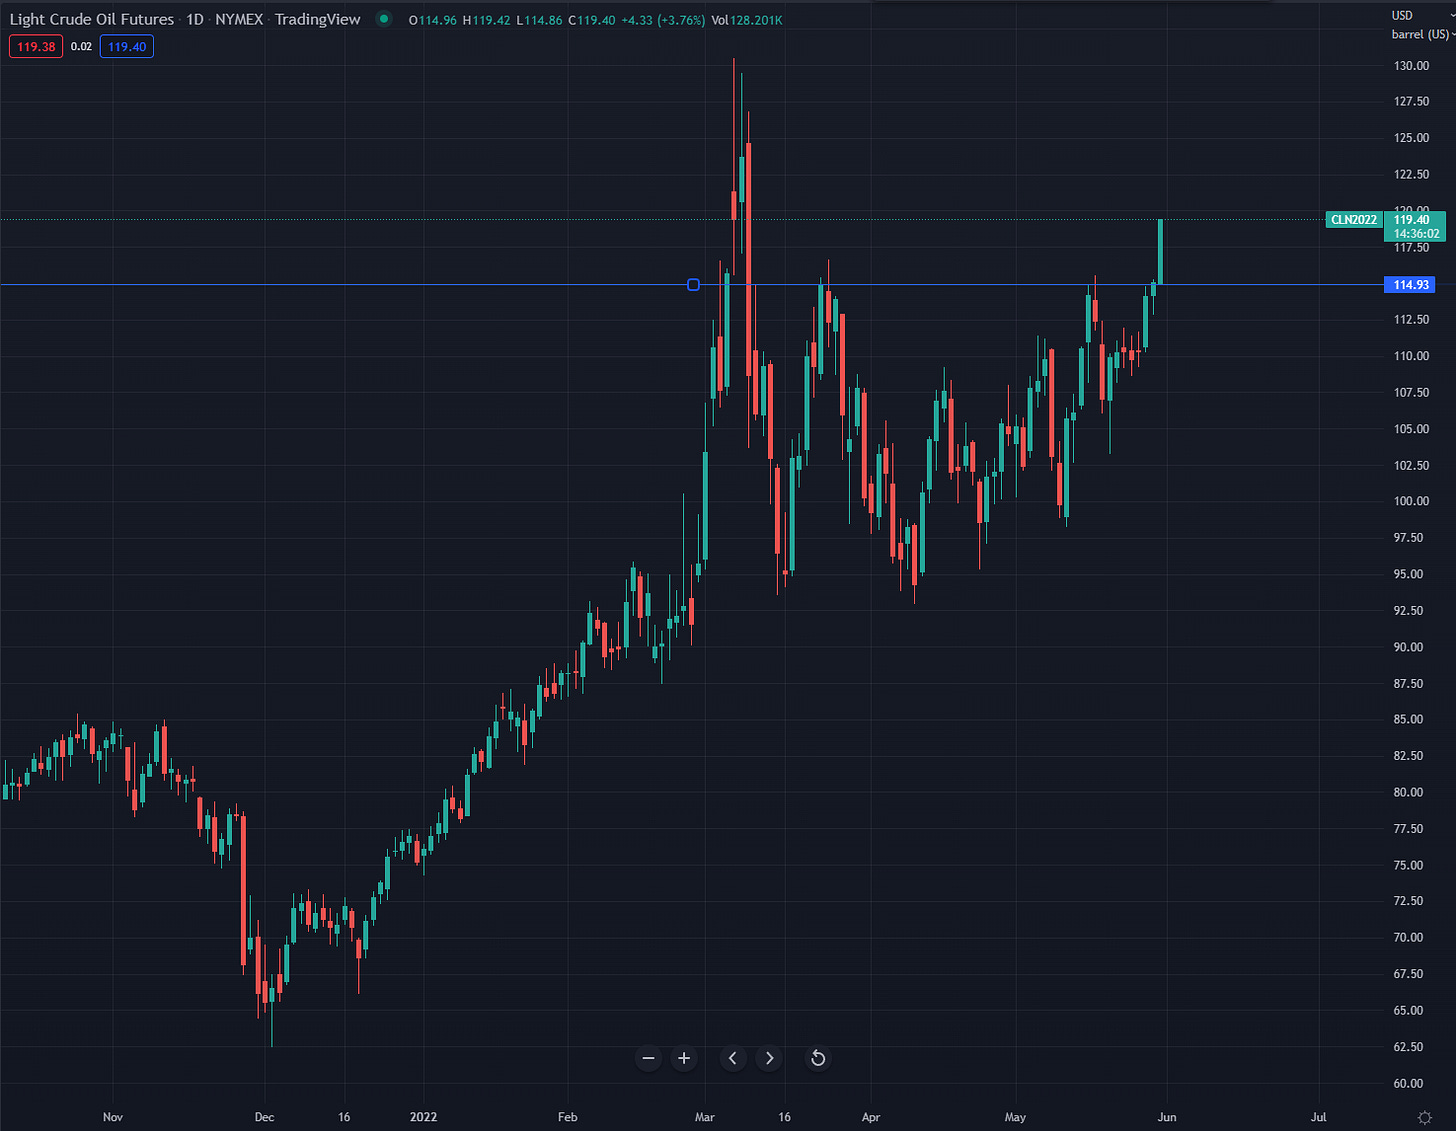
The oil market is doing the Fed's tightening for them
Last night the EU announced that it will place a partial ban on Russian oil, with a carveout for Hungary, Czeck Republic, and Slovakia. Hungary has been vehemently opposing the ban as their economy cannot function without Russian oil, so they get a free pass for now. WTI is up over $4 since the announcement, back at levels not seen since late March. High energy prices are like a tax on consumer spending just like high interest rates are like a tax on investment and borrowing.
The Fed seems determined to hike 50 bp in its next two meetings. However, the latest Fed minutes point to uncertainty beyond that. Bostic (non-voter) called for a pause in September while Waller (voter and a known hawk) has called for “several 50 bp hikes”, suggesting he prefers 50 bp in Sept. If we assume that the next two 50 bp hikes are a lock, then the space between a terminal rate of 175 bp (2x50bp then a pause) to 300 bp (Fed’s terminal rate) is the box of outcomes the market will be playing in.
There is a lot more downside to the rate trajectory than upside, and when you throw in some scary looking charts pointing at slower growth or recession ahead, betting on fewer hikes than what the market is pricing looks like a decent bet.
Scary chart #1. This was from a couple weeks back when oil was lower.
Scary chart #2 - The US cycle short-lead combines short term rates, commodity prices, and the US dollar to predict the ISM index, which is the economic data print most correlated to US equities. An ISM down at 37.7 would be commensurate with a 40-50% drawdown in SPX.
Source: Real Vision
Scary chart #3 - housing.
Housing is the bedrock of the US economy because it is the greatest proportion of household wealth and a large source of employment and manufacturing. My aunt, who is one of the largest real estate brokers in California and the US, says the market has cooled off a lot this month. In April the market was white hot, with tight inventory, but it has suddenly shifted from a seller’s market to a buyer’s market quickly. I’m hearing anecdotes of sellers rushing to list their homes while buyers back out of deals in escrow.
Scary chart #4 - Employment
Source: Piper Sandler
We are hearing anecdotes of layoffs and hiring freezes in the tech and retail industry. It’s only a matter of time before these show up in jobless claims and non-farm payrolls.
But how can the Fed back off on tightening when inflation is white hot? What matters more for yields, growth or inflation?
There is evidence that a surge in goods inventories and a collapse in demand will result in goods deflation.
Source: JDI research
Variant Perception’s leading indicator of inflation suggests inflation will peak soon.
With regard to the largest component of the CPI, shelter: “Our shelter CPI model is stabilizing, and suggests that further rent inflation upside is limited (last chart). The current overshoot is likely due to distortions in data collection and eviction moratoriums. Apartment List’s national rent report points to rent growth cooling from highs last summer, but will remain well above its pre-pandemic trend owing to tight inventories.” - Variant Perception
While the internals of the equity market are pricing a cyclical slowdown, bond futures positioning is stubbornly focused on inflation and hawkish central banks.
Source: Vanda Research
And finally, history shows that in a recession, growth does matter for yields
Putting it all together, what do I see? Lower yields, but no respite for risk assets or the real economy as oil surges higher and increases the odds that the US goes into recession. This remains a bad environment for risky assets so equities and crypto should be a sell on rallies. As long as we are in a sideways or orderly market, USD should track Treasury yields and weaken as disappointing data hits the tape.
Current positions:
Short USD against JPY, CHF, and XAU
Short ES (short term tactical position, 4210 stop and 4000 target)
Long WTI futures
Long June 23 Eurodollar futures
Waller’s hawkish comments are putting pressure on my long Eurodollar futures and short USD positions. I was considering cutting exposure there, but as I wrote this post, I realized I should stay the course. At the moment, long WTI and short ES (which I sold at 4188 and is now 4155) are making up for those MTM losses. Stocks are overbought partly due to short covering and month end buying. Once that subsides, the focus may shift towards the negative effects of higher oil on the economy.
Thanks to Sam Shiffman for helping me with this post
Disclaimer:
The content of this blog is provided for informational and educational purposes only and should not be construed as professional financial advice, investment recommendations, or a solicitation to buy or sell any securities or instruments.
The author of this blog is not a registered investment advisor, financial planner, or tax professional. The information presented on this blog is based on personal research and experience, and should not be considered as personalized investment advice. Any investment or trading decisions you make based on the content of this blog are at your own risk.
Past performance is not indicative of future results. All investments carry the risk of loss, and there is no guarantee that any trade or strategy discussed in this blog will be profitable or suitable for your specific situation. The author of this blog disclaims any and all liability relating to any actions taken or not taken based on the content of this blog. The author of this blog is not responsible for any losses, damages, or liabilities that may arise from the use or misuse of the information provided.


