The bull market has a long runway
The relentless uptrend in US equities has been confounding many an investor over the past month. I haven’t met too many people happy with the current move (other than myself), as most people are either underinvested, in cash, or short. If you had asked me two weeks ago how long this could go on for, I might have expressed doubts about the durability of this uptrend. However, things have changed since last week’s weaker than expected CPI that make me believe this bull market has a long way to go.
What kills most bull markets late in the cycle is when short and long-end yields shoot up too quickly to price in a hotter growth and inflation environment. Fears of Fed tightening leading to a recession put a lid on the risk-taking and animal spirits of the previous bull market. The market went through the worst of this last year and survived without suffering a recession. Sure, we had rolling recessions in housing, regional banking, and manufacturing, but we didn’t get a surge in unemployment or a coordinating credit cycle downturn.
We are now 1-2 hikes away from the end of the Fed hiking cycle, while headline and core inflation are slowing towards a 2% annualized rate, with more disinflation in goods and shelter coming down the pipeline over the next 6-12 months. The window for a recession to hit the economy has closed for now, as it will take at least several quarters for inflation to trough and reaccelerate from the lows.
It was this realization that sent Treasury yields into a dramatic reversal from their previous uptrend, turning the move in yields into a tailwind from a headwind.
There is a lot of room for bearish positioning in Treasuries to unwind further, putting downward pressure on yields. Lower yields mean more room for P/E expansion in equities, lengthening the runway for this bull market to continue.
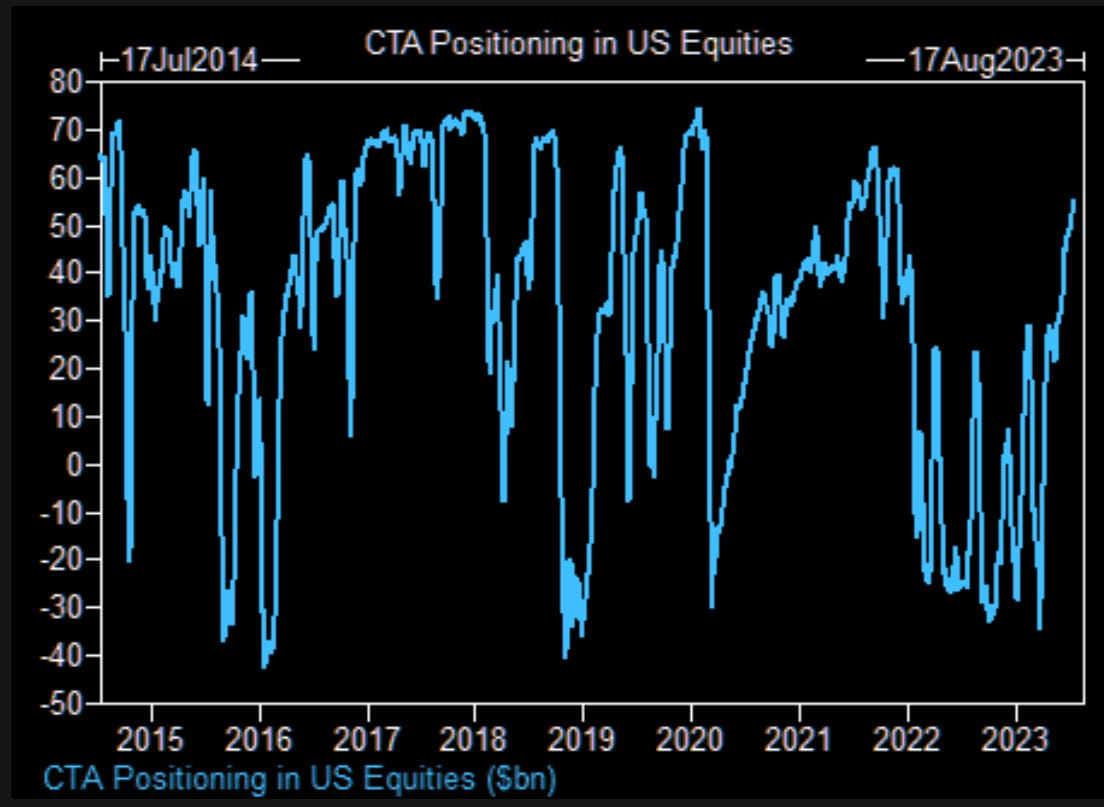
Bears point to excessive bullish sentiment and positioning and equities. I would be careful to draw strong conclusions from sentiment and positioning indicators in equities, as there are so many conflicting signals and one can always find a chart to support his bearish or bullish opinion.
Charts showing bullish sentiment and crowded longs
Charts showing bearish sentiment and uncrowded longs
In my experience of over two decades of investing in equities, bearish sentiment and light positioning in equities tend to be a great indicator for market bottoms, but bullish sentiment and elevated positioning in equities is NOT a strong signal for a top, as bull markets can always last longer than people think. The chart below from the BofA FMS shows that big tech and growth can remain the market’s “most crowded trade” for many months in a row!
Disclaimer: The content of this blog is provided for informational and educational purposes only and should not be construed as professional financial advice, investment recommendations, or a solicitation to buy or sell any securities or instruments. The blog is not a trade signaling service and the author strongly discourages readers from following his trades without experience and doing research on those markets. The author of this blog is not a registered investment advisor or financial planner. The information presented on this blog is based on personal research and experience, and should not be considered as personalized investment advice. Any investment or trading decisions you make based on the content of this blog are at your own risk. Past performance is not indicative of future results. All investments carry the risk of loss, and there is no guarantee that any trade or strategy discussed in this blog will be profitable or suitable for your specific situation. The author of this blog disclaims any and all liability relating to any actions taken or not taken based on the content of this blog. The author of this blog is not responsible for any losses, damages, or liabilities that may arise from the use or misuse of the information provided.


