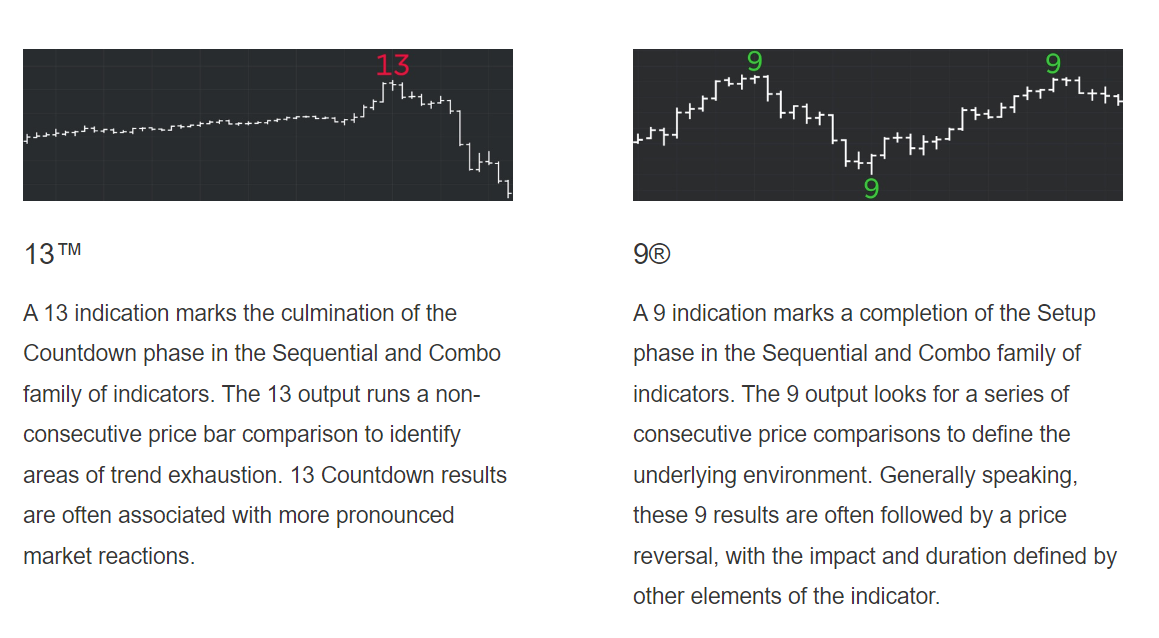
I’m a big fan of using Demark indicators as a tool for trading countertrend moves. In case you are not familiar with them, this is a brief description of what they are:
Essentially, the Demark system has its special way of counting bars in a trend, and when a 9 or 13 count is triggered, there should be a higher probability of a countertrend move. I like to use 9s to warn me of pullbacks in a trend or reversals within a range. 13s are useful for identifying exhaustion in a trend.
As with most indicators, Demark 9 and 13 counts should not be used solely on their own, but in conjunction with other indicators, as well as your fundamental view of the market. What gets my attention is when one or more of the following setups happen:
I see a 9 or 13 on 2 out of the 3 following time frames - 4 hr, daily, and weekly.
A 9 or 13 occurs when RSI on that timeframe is oversold/overbought.
A 9 or 13 occurs at a large technical level.
What we are seeing today is a confluence of Demark 9s and 13s in many USD pairs after a multi-month downtrend. I’ve been short USD throughout this entire downtrend, so I can’t ignore these signals and have to take some action to protect my gains.
Let’s go through the charts:
Usd/cnh daily - 9 count and RSI oversold
Usd/cnh weekly - 9 count as we approach a previous congestion zone
This signal is enough for me to take action, so I covered my usd/cnh short at 6.80 yesterday and plan to resell higher. I originally posted about going short at 6.9850.
Usd/jpy weekly - 9 count. There are no Demark triggers on other time frames and usd/jpy is not oversold on the daily or weekly time frame, so I’m not acting on this right now.
Eur/usd daily - 13 count as we approach a previous pivot zone of 1.0760-90.
Eur/usd 4 hr - 9 count triggered yesterday into an overbought RSI
The confluence of bearish signals in eur/usd is strong so I’m going to sell short here at 1.0742 with a stop at 1.0802. My target is 1.03, which is the 38.2% Fibonacci retracement from the Sep 2022 low.
Gold daily - 13 count and almost overbought
Gold weekly - 9 count as we approach a previous pivot zone of 1890-1900
I’m long gold as a longer term trade, but if I was long with leverage, I’d be taking profits or lightening up, as Demark is signalling a pause or pullback in the trend.
Aud/usd 4 hr chart - It has been choppy and rangy, but 9s and 13s have had good predictive power in these swings
Anyway, that’s all I have for now. Obviously a much weaker than expected CPI print could extend the USD downtrend further, but I believe the bar is higher right now for CPI to generate a sustained move to the downside.
Current portfolio of trade ideas
Disclaimer:
The content of this blog is provided for informational and educational purposes only and should not be construed as professional financial advice, investment recommendations, or a solicitation to buy or sell any securities or instruments.
The author of this blog is not a registered investment advisor, financial planner, or tax professional. The information presented on this blog is based on personal research and experience, and should not be considered as personalized investment advice. Any investment or trading decisions you make based on the content of this blog are at your own risk.
Past performance is not indicative of future results. All investments carry the risk of loss, and there is no guarantee that any trade or strategy discussed in this blog will be profitable or suitable for your specific situation. The author of this blog disclaims any and all liability relating to any actions taken or not taken based on the content of this blog. The author of this blog is not responsible for any losses, damages, or liabilities that may arise from the use or misuse of the information provided.


