Signs that strong Jan data was an anomaly - return to Goldilocks?
Covering Treasury short, going long aud/usd
I’m going to make this short because I already sent out a post today. This is the first time I’ve posted twice in a day!
I covered my 10 year Treasury short at 110’28 after today’s US data releases because it’s becoming clear from what little February data that we’ve seen that the strong Jan data was an anomaly. I did previously say in my last post that the recovery in data would be durable thanks to the China reopening. However since last week, a few things have happened:
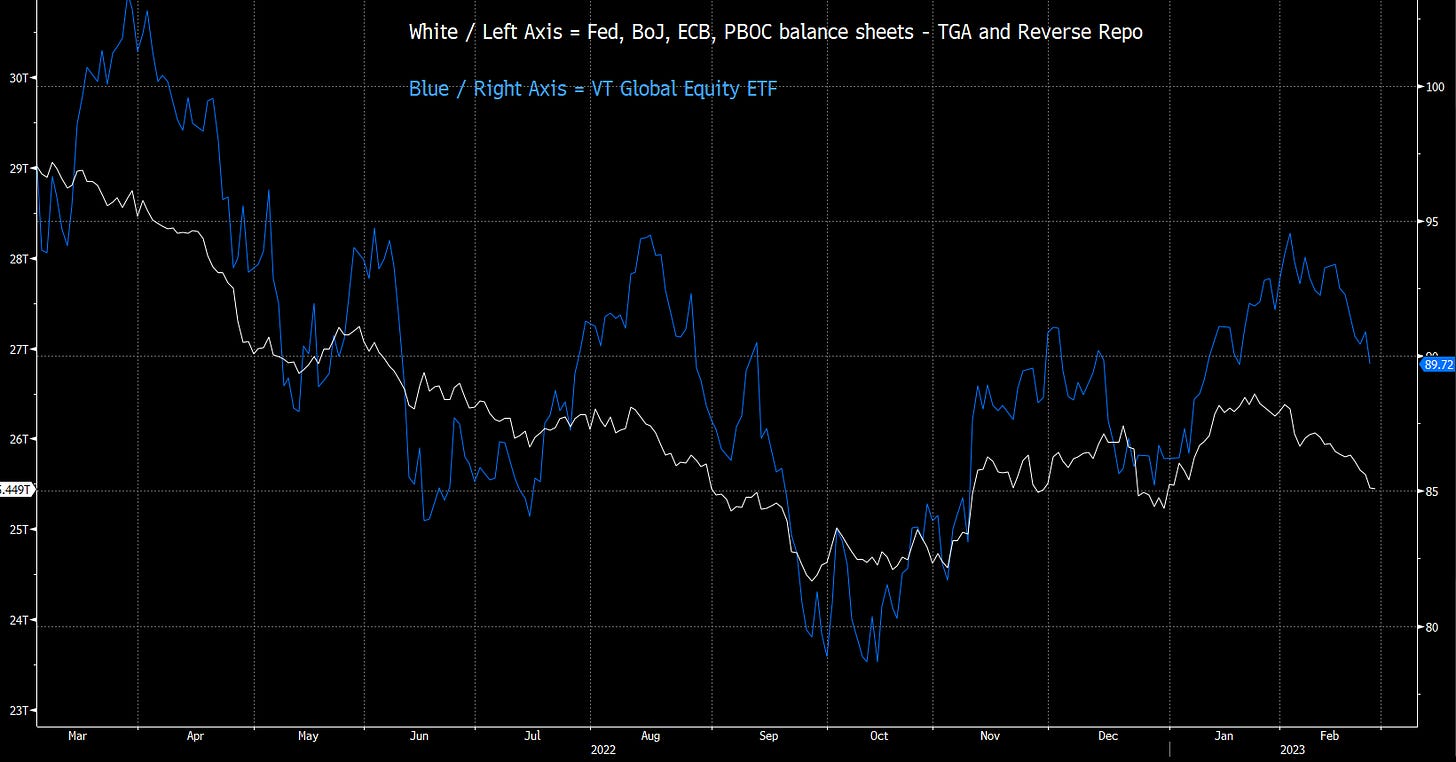
Global liquidity (Fed balance sheet, ECB, BoJ, China minus Treasury general account and reverse repo) has rolled over, which should weigh on economic momentum
Chinese stocks have rolled over and FXI is down 15%, suggesting the China reopening impulse was neither strong nor long-lasting.
Most importantly, initial US Feb data show significant downward momentum. Here is a rundown:
Dallas Fed manufacturing: -13.5 vs -9.3 expected and -8.4 prior. “The new orders index was negative for a ninth month in a row and moved down nine points to -13.2…The employment index dipped below zero to -1.0 after tracking above average for more than two years.”
Consumer confidence: 102.9 vs 108.5 expected and 107.1 prior. Conference board expectations were noticeably lower at 69.7 vs 77.8 prior.
Richmond Fed: -16 vs -5 expected and -11 prior. “Of its three component indexes, shipments saw the largest change, declining notably from −3 in January to −15 in February. The employment index declined from −3 to −7 in February, while the new orders index remained unchanged at −24…The average growth rate of prices paid remained nearly unchanged, while the average growth rate of prices received decreased in February. Firms expect both to moderate over the next 12 months.”
Dallas Fed services: -9.3 vs -15.0 prior. This report was less bad. “Labor market indicators pointed to continued growth in employment and workweeks. The employment index fell two points from 10.5 to 8.8, while the part-time employment index rose three points to 4.0….Price and wage pressures remained elevated, though there was some moderation in wage growth. The input prices index ticked up from 38.8 to 40.6, while the selling prices index remained mostly flat at 19.8. The wages and benefits index moved down two points to 19.4, still elevated relative to its average reading of 15.7.”
Overall, none of this screams recovery to me. It doesn’t warrant another bout of Fed panic and aggressive tightening. Of course, the picture could change with more incoming data. Tomorrow and Friday we get ISM manufacturing and ISM services.
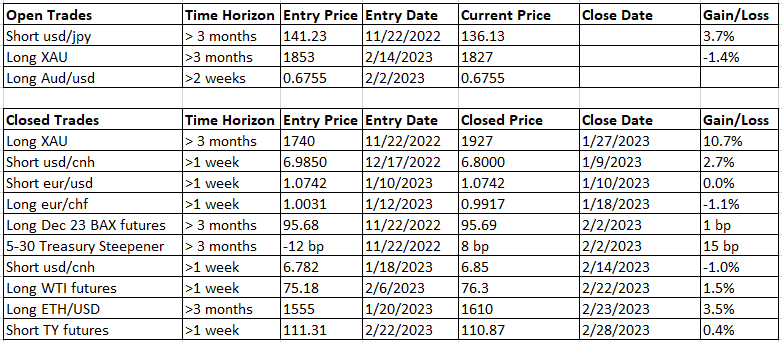
Since Oct 2022, USD has been more responsive to recession fears while yields have been more responsive to inflation fears. To position for the end of this mini taper tantrum and a return to goldilock/recession fears, I like short usd/jpy and long gold, both of which I already have on as long term trades. At this juncture I believe they make good tactical trades as well. I’m adding another short USD trade to the book - long aud/usd. Aud/usd logged a 9 Demark count yesterday. I am going long at 0.6755 with a stop at 0.6690 as a tactical trade. My target is the pivot level and big round number 0.7000.
Some of you might ask - why express a view that data weakens by going long aud/usd? The reason is that weaker data puts us back into a Goldilocks regime, which actually isn’t that bad for risk assets. Aud/usd was in an uptrend in Q4 when data was deteriorating and the whole world was worried about recession.
More interesting charts:
Usd/jpy has hit a cluster of levels - 200 dma at 137.16, 100 dma at 136.98, and 38.2% Fibonacci retracement at 136.66.
Eur/usd logged a 9 Demark count yesterday
Big level in 2 yr Treasury yields
The market is now pricing in 25 bp at each of the next three Fed meetings. If data rolls over and continues to weaken, how much runway does the Fed hiking cycle have?
This year I’ve found myself changing my mind a lot. In Jan I was talking about Goldilocks, then I got on the higher for longer trade last week (just in time to catch the hot PCE inflation number), and now I am back to positioning for Goldilocks. The case for a return to Goldilocks is based on a handful of second tier data, but if I wait for NFP and CPI to position for disinflation again, the move will have already happened.
Fidenza Macro portfolio trades:
Disclaimer:
The content of this blog is provided for informational and educational purposes only and should not be construed as professional financial advice, investment recommendations, or a solicitation to buy or sell any securities or instruments.
The author of this blog is not a registered investment advisor, financial planner, or tax professional. The information presented on this blog is based on personal research and experience, and should not be considered as personalized investment advice. Any investment or trading decisions you make based on the content of this blog are at your own risk.
Past performance is not indicative of future results. All investments carry the risk of loss, and there is no guarantee that any trade or strategy discussed in this blog will be profitable or suitable for your specific situation. The author of this blog disclaims any and all liability relating to any actions taken or not taken based on the content of this blog. The author of this blog is not responsible for any losses, damages, or liabilities that may arise from the use or misuse of the information provided.


