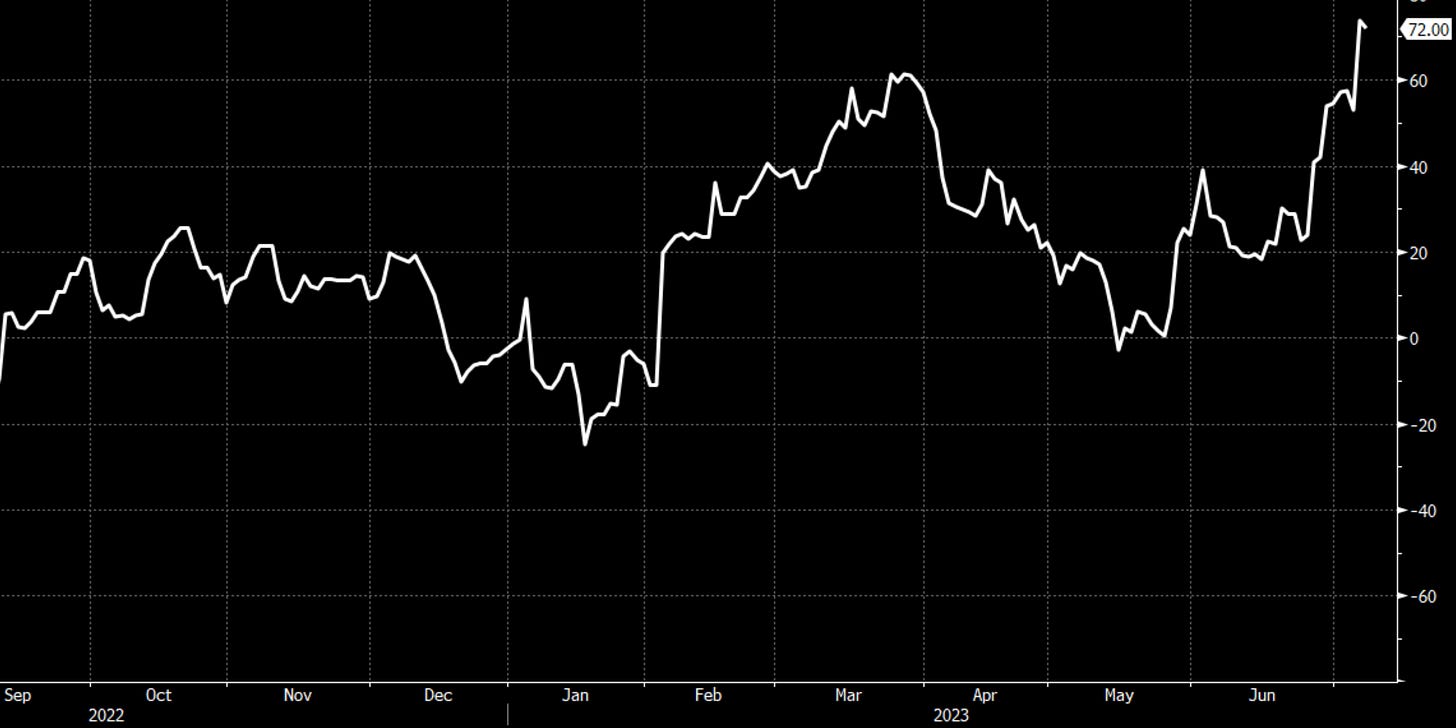
The last year and a half have been dominated by stagflationary or disinflationary regimes, punctuated by occasional bouts of recessionary regimes (such as the regional banking crisis in March). The correlation between stocks and Treasuries has been positive for most of the time as the market was preoccupied with inflation and Fed tightening. That has changed over recent weeks as we have seen the return of the reflationary regime - where risk assets go up and Treasuries down, while commodities trend higher and USD trends lower (due to flows exiting USD as a safe haven). Inflation is becoming less of a concern, as headline YoY CPI is expected to print 3.0% this week, while inflation surprises have been muted compared to last year. Meanwhile growth prospects in the US seem to be bottoming out, with US data surprises surging to the upside.
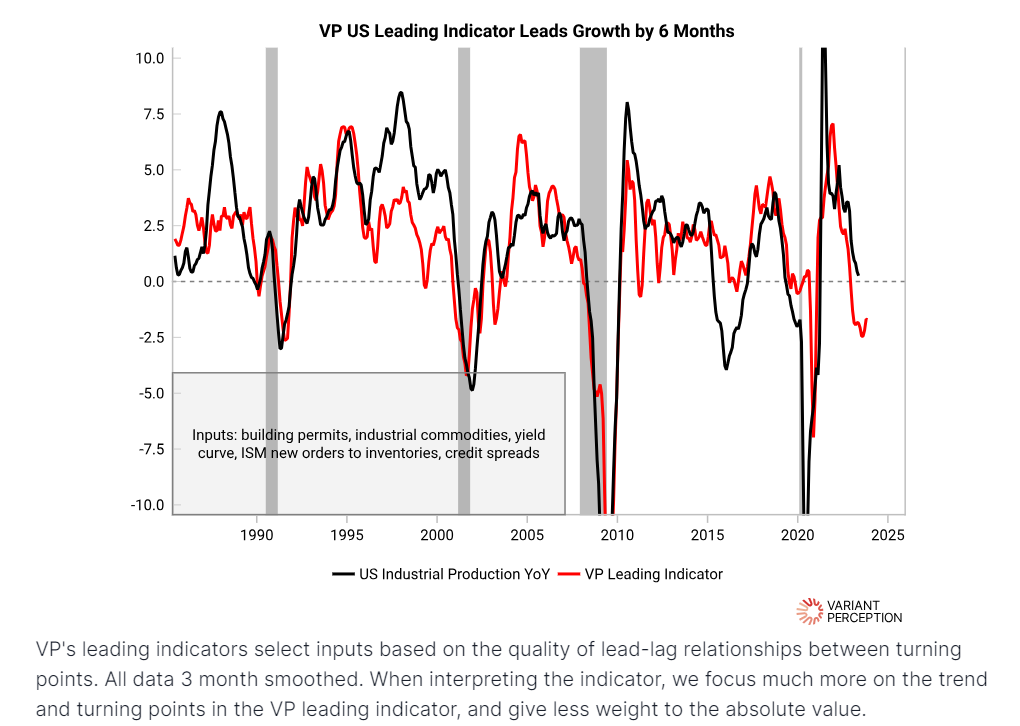
Variant Perception’s US growth leading indicator has stabilized
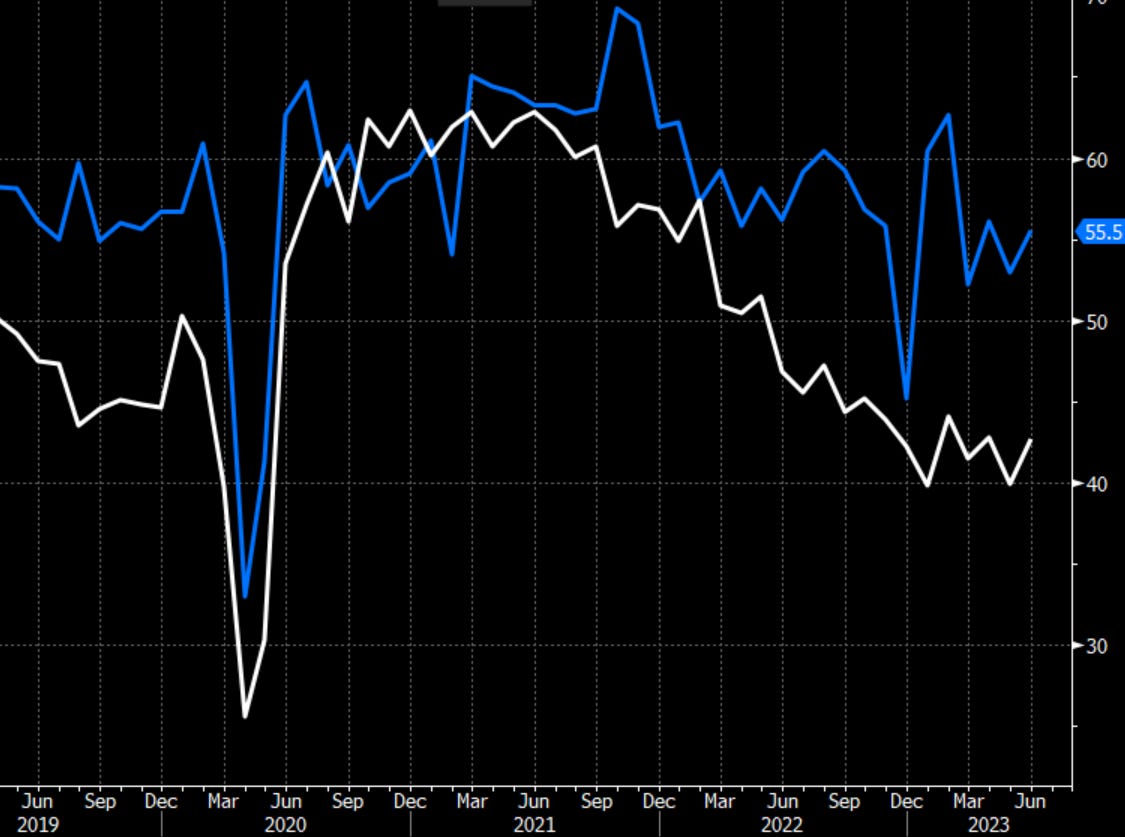
ISM manufacturing new orders (white) and services new orders (blue) are holding up well.
I’m not going to call this a soft landing or no landing, because that terminology is confusing and overused, but a better description of the global macro picture is that the current and projected trend of growth is rising at a faster pace than the current and project trend of inflation, which means we are seeing real growth rebound after a period of contraction. This is why my portfolio is predominantly skewed towards risk-on right now, which I’ll go into in the paid subscribers section of the post.
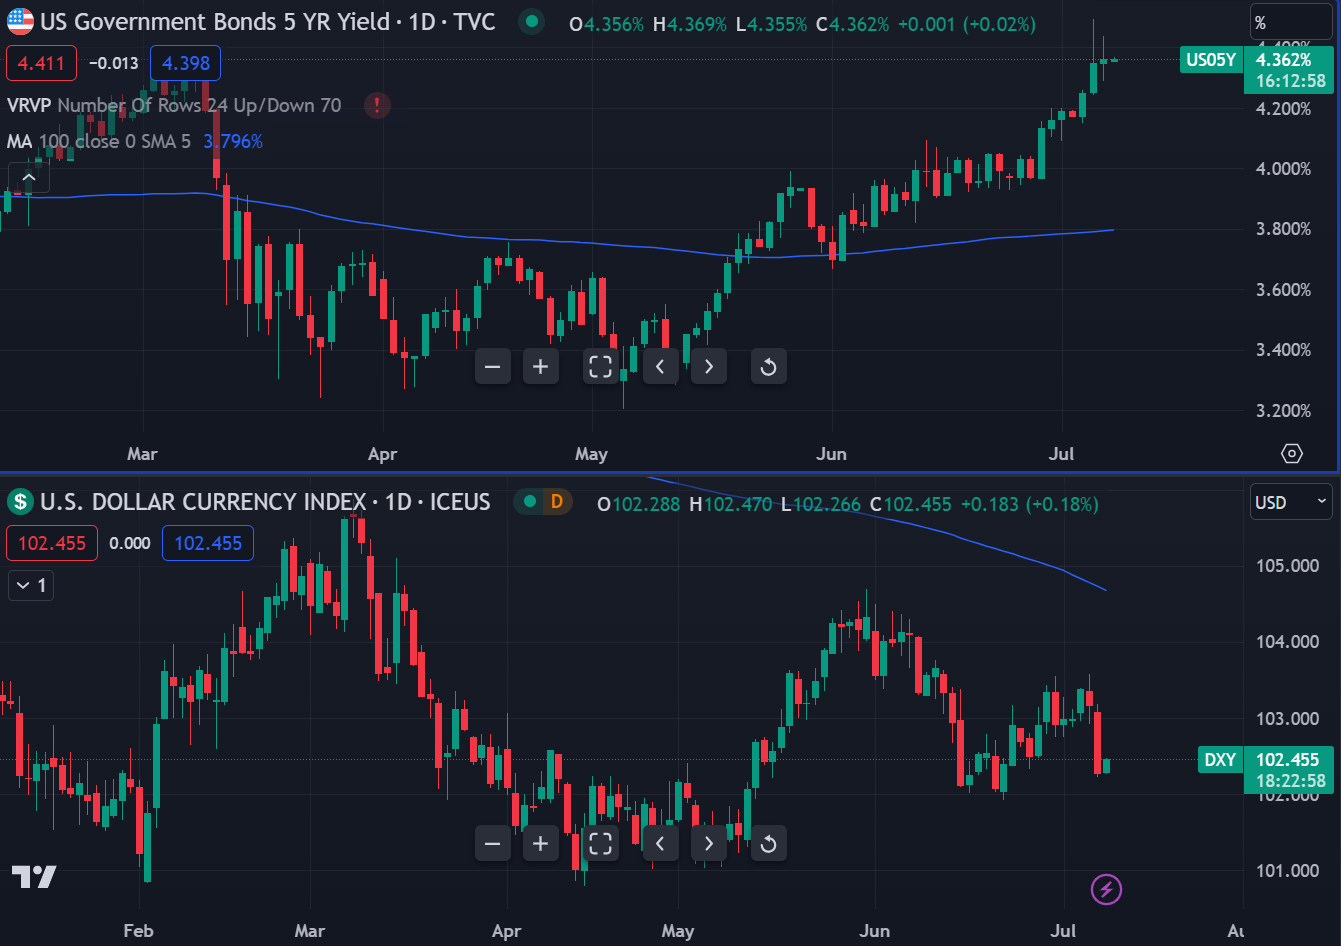
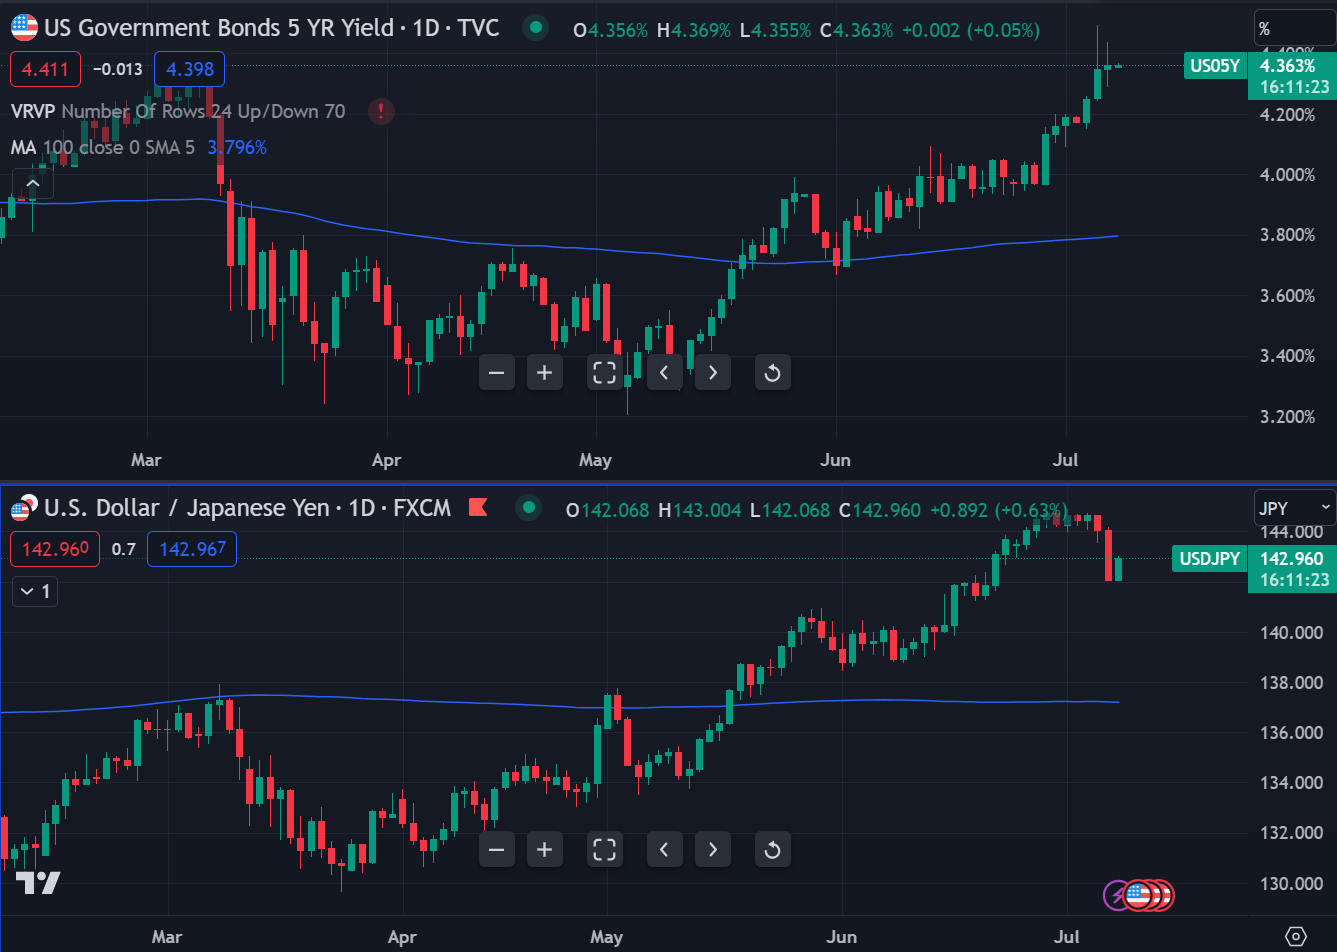
In FX, rising US yields has not resulted in a higher USD, suggesting the market is seeing outflows from USD as a safe haven, which is consistent with a reflationary regime.
Even USDJPY, which normally trades tick-for-tick with US yields, can’t follow yields higher.
The reflationary trend needs Europe's involvement and China's growth. Currently China's economy is in a cyclical downturn, with its assets lagging behind the global market, and growth and inflation rates falling short of expectations. China CPI just hit 0% today! The Chinese government has no choice but to crank up the monetary and fiscal stimulus. While the timing and magnitude of stimulus is unknown, it is almost an inevitability and something I would not bet against. As China's economy stabilizes, it should help catalyze a rebound in European and emerging market growth, further weakening the USD. This, in turn, would provide another boost for the reflation trend.
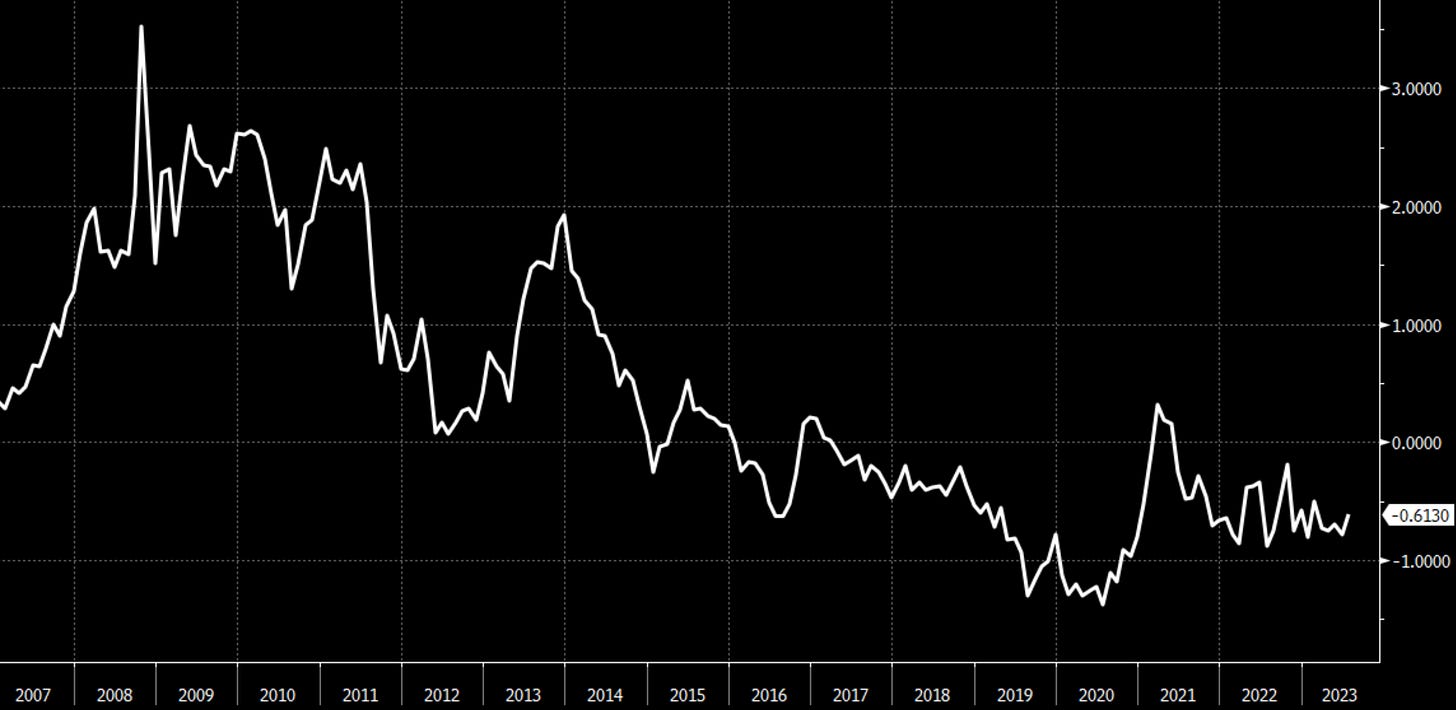
One result of the reflationary regime that is not yet fully priced in would be a bear steepening of the Treasury curve and a rebound in term premium (defined as the extra yield bond investors expect to receive to take longer duration risk). If it looks like we are going to avoid a recession, it begs the question - why would Treasury investors own 10 yr Treasuries at 4.08% vs Tbills at 5.5%? 30 yr yields at 4.06% with the US debt-to-GDP ratio at 120% seem even more illogical. This was sensible when extending the duration of your Treasury holdings would benefit from anticipated rate cuts due to a recession and a downturn in the credit cycle. But if those recession projections get pushed out indefinitely, that inversion of the curve no longer makes sense. I expect the Treasury curve to resteepen and for the Treasury term premium to trend higher from here. More on how I’m positioning for this in the paid subscribers section.
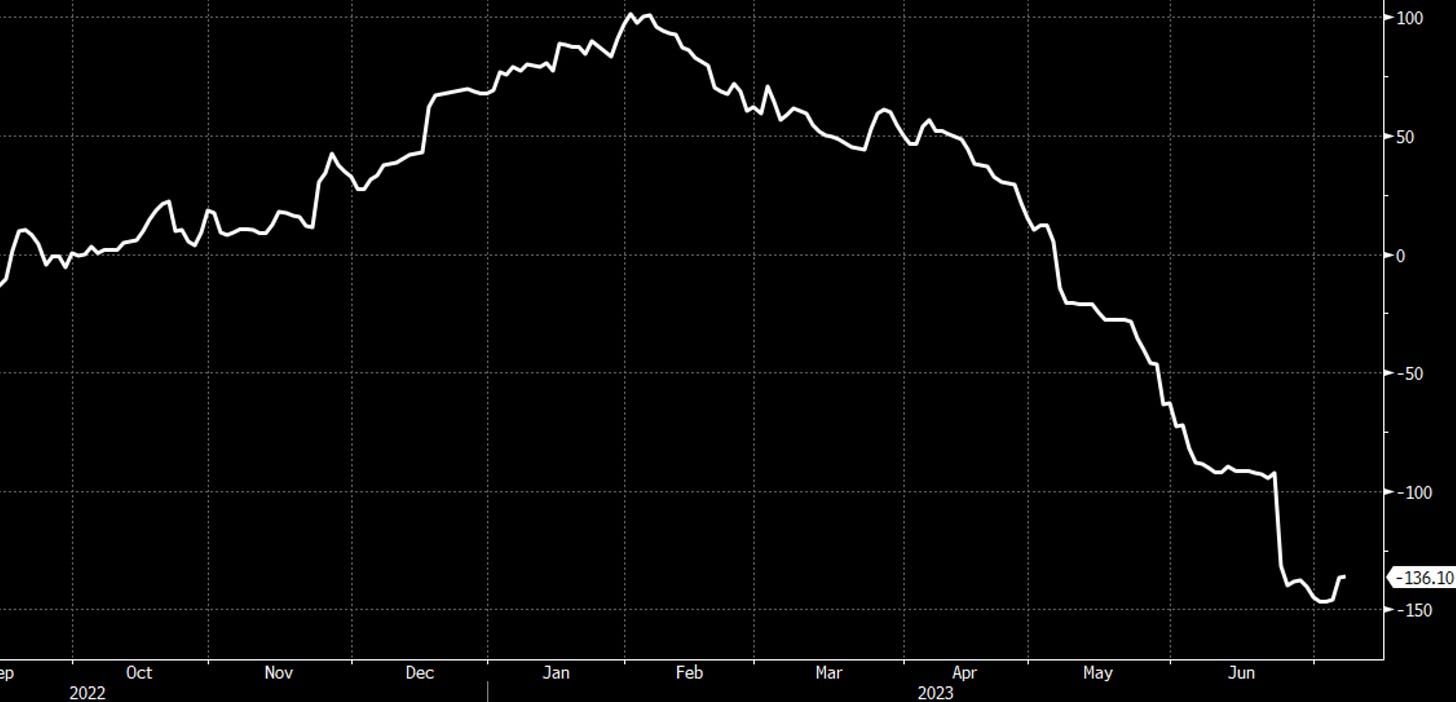
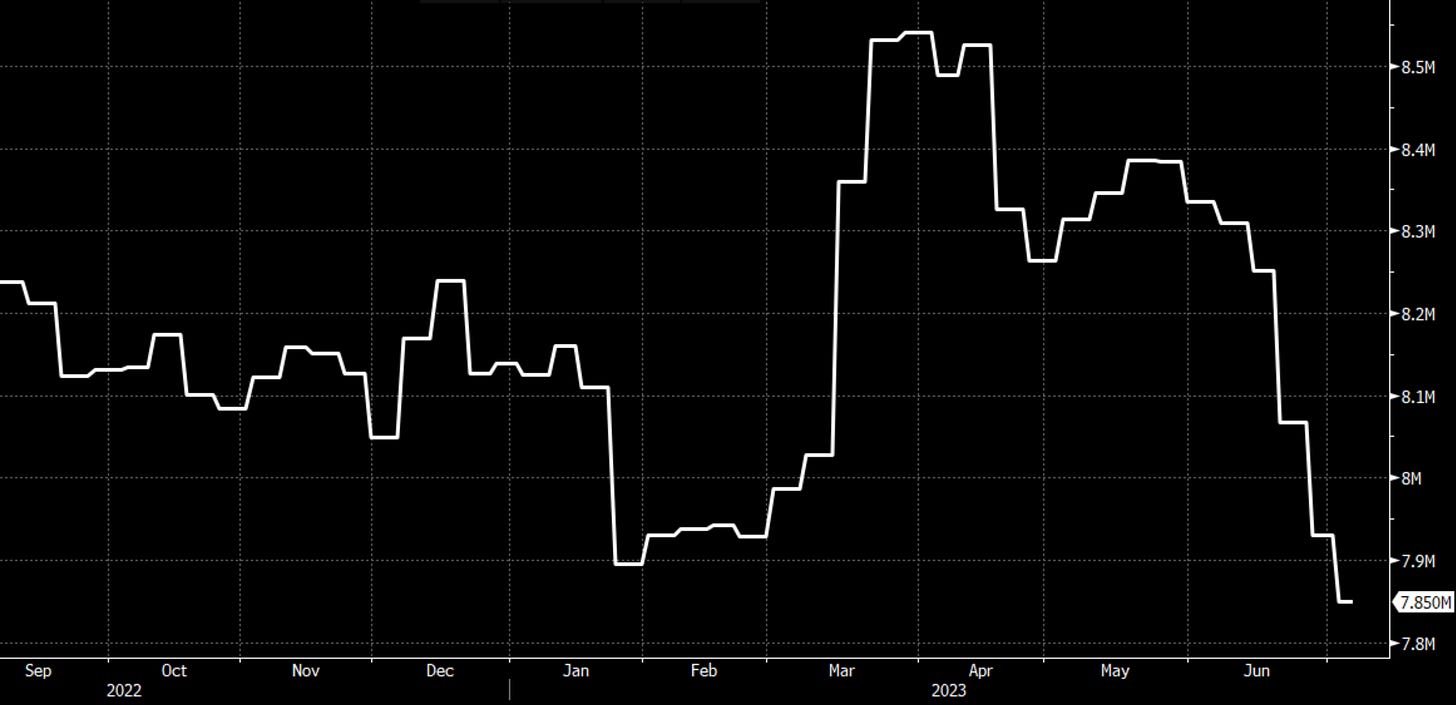
What about the withdrawal of net liquidity I have been discussing all spring - wasn’t that supposed to be a negative catalyst for risky assets? It has been over a month since net liquidity started turning lower, and it is now below the March lows.
I have three theories for why the sharp drop in net liquidity didn’t transmit to asset prices:
There was a lot of cash parked in fixed income instruments that was waiting for a recession and a deeper bear market to hit. The flow of capital putting money back into work in risky assets more than made up for the withdrawal in net liquidity.
Bank reserves haven’t gone down as much as net liquidity. This may be due to FHLB lending to banks that isn’t captured by the let liquidity measure. Unfortunately I can’t find data on FHLB lending on a frequency less than quarterly, so I haven’t been able to add that data to my net liquidity metric.
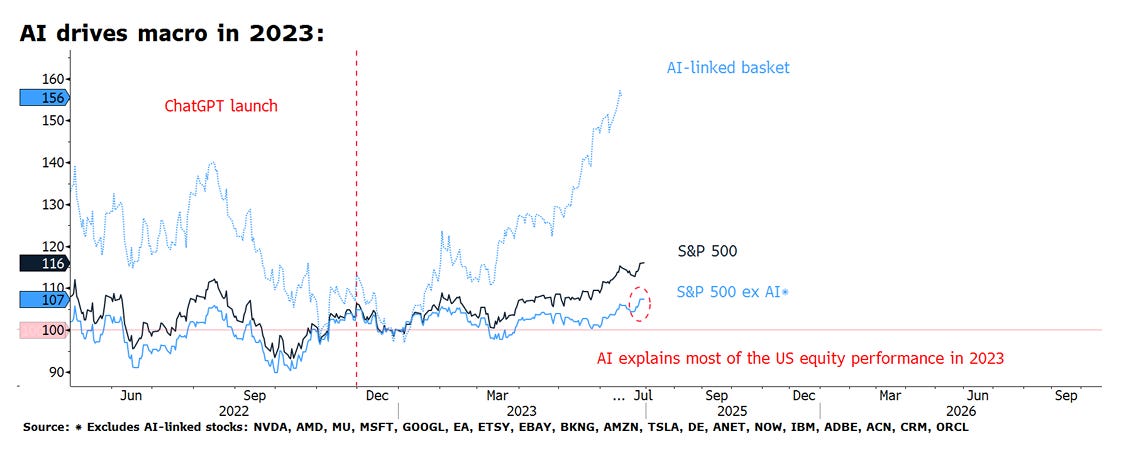
Perhaps net liquidity DID depress asset prices when you remove the AI boom from the picture. The S&P 500 ex-AI beneficiaries has been sideways for the entire year.
If every marginal dollar of investment into equities is going into AI beneficiaries despite a challenging global macro backdrop, then that makes me even more bullish AI and Nasdaq (over half the index is composed of AI beneficiaries).
The Treasury General Account is now at $513B, which means there’s only $187B of liquidity withdrawal until the Treasury meets its TGA target of $700B. Yellen is also drawing funds out of the RRP to offset the drain in bank reserves by issuing 4-8 week bills, so maybe we will only get another $100-150B in liquidity withdrawal over the net month. The window for net liquidity to be a headwind for asset prices is closing quickly, which makes me less worried about liquidity as a downside risk.
I’ve added some new positions over the past week to capture where I think this reflationary trend is going.
Keep reading with a 7-day free trial
Subscribe to Fidenza Macro to keep reading this post and get 7 days of free access to the full post archives.


