Primer on rolling futures month by month, and reading the futures curve
I’m in the middle of nowhere in Mozambique this week with not a lot of access to internet and time to write, so I’m publishing this post that I wrote a few weeks ago. Hope it’s helpful to those readers who are newer to futures trading.
Many of my trades are expressed via futures contracts, an asset class that is usually not available to retail traders. The fact that futures expire every 1-3 months creates some interesting nuances about trading them, so I wanted to give a tutorial on how to manage this aspect of futures.
Those who have zero clue about trading futures should consider buying or borrowing this book:
Don’t be intimidated by its 700 page length - you really only need to read chapter 1 to get a “how-to” introduction to trading futures, and everything else is additional knowledge about technical analysis, trading systems, fundamental analysis, etc.
Expiring futures contracts
Be aware of when the futures contract in which you have a position expires so your exposure doesn’t get disrupted, and never hold a contract until expiry. If the futures contract requires physical delivery, your broker will likely liquidate your position a few days before expiry to prevent you from going through the physical delivery process. If the contract is cash settled, you will get taken out of your position at the settlement price. Interactive Brokers has a setting that will automatically bring up the next month’s contract on your watchlist when it comes time to roll your position.
Determining the most liquid front contract
Whenever I put on a futures trade for the Fidenza Macro portfolio, I specify which contract I’m trading in, and it’s usually the front (closest month) contract which has the best liquidity. When the front month is about to expire, I have to “roll” the position to the next contract by closing out the current position and opening the same size position in the next contract. When deciding which month to initiate a new position or to roll an existing position into, the most helpful rule is to check the size of the volume and open interest (you can do this on Trading View, Interactive Brokers, and other platforms).
If you’re using Interactive Broker’s software, you can add volume and open interest into your watchlist columns. Below, you can see that gold futures (GC) has the most volume in Dec, almost nothing in Sept (as it’s close to expiry), and a little volume in October. This is why you should NEVER just automatically roll to the next month - sometimes the next liquid contract is 2-4 months away.
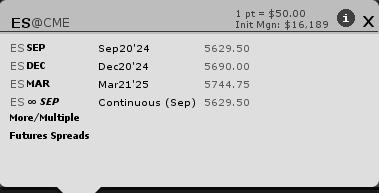
As a general rule, equity indices, interest rates, and bonds expire every quarter (March, June, Sept, and December), which makes it easy to figure out what month to roll to. In energy, the front contract is always the closest month, so if you are long WTI oil Sept, you would just roll it to Oct to maintain your position. Commodity futures such as precious metals and soft commodities are the trickier ones, and that’s where you need to be aware of which contracts are the most liquid ones to roll to.
How to roll to the next contract
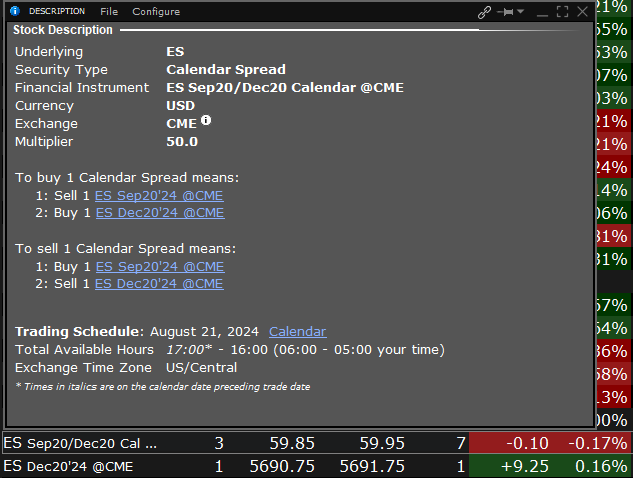
For the longest time, I rolled by contract by doing two manual trades - closing my current position and opening a new one in the next contract. I later realized this was the stupidest and most costly way to rolling my contracts due to price slippage. It turns out that Interactive Brokers offers a futures spread product where I can buy one month and sell another in a single trade. This futures spread product has great liquidity. Here’s a step-by-step guide to trading a futures spread:


What the futures curve means
For physical commodities, the futures price on any given month reflects current supply and demand dynamics. If the market is tight, ie there is more near term demand than supply, the near futures contracts will trade at a premium to the later contracts. This is known as backwardation. If the market is well-supplied, ie there is more near term supply than demand, the near futures contracts will trade at a discount to the later contracts (otherwise known as contango).
Below is the futures curve for CL (crude light) - the market I usually trade to express my views in crude oil. You can see that in this example, the front month trades at $73, whereas if you don’t mind waiting until December 2027 to receive your barrels of oil, you only need to pay $64.
Supply and demand dynamics usually express themselves in the first 12 months of the curve. Below is a chart of the spread between the first month of the CL contract minus the fourth month. When the spread is positive, the market is in backwardation and supply is tight. When negative, the market is in contango.
You can see that around the time of the Russian invasion of Ukraine (March 2022), the curve went into extreme backwardation, reflecting the market’s concerns that Russian supply would get cut off from the global market. As Russia continued to pump oil and found willing buyers in China and India, those fears subsided, and the curve went back into contango by the end of the year.
The shape of the first twelve months of the futures curve often provides informational value on the future direction of prices. For example, let’s say the price of light crude is going up because trend following funds are buying, but the move isn’t confirmed by a backwardation of the curve. This could be a sign that there is no real physical tightness in the market, and that the rally will be short-lived. Extreme backwardation, like what we saw during the Russian invasion of Ukraine, or extreme contango, like what we saw when oil prices went negative in 2020, can also be reverse indicator and a sign of a climax top or bottom (see chart below). Experienced traders know the nuances of reading the futures curve and drawing directional signals from it.
Some futures have financial instruments (as opposed to physical commodities) as their underlying, such as the S&P 500 and currencies. For these instruments, the futures curve doesn’t provide much useful information about the supply and demand of the underlying. The difference between the futures price and the underlying price reflects the borrowing cost of owning that asset with leverage. For example, If the price of S&P 500 ES contracts trades $40 above the index level, that reflects the fact that one would have to pay the equivalent of $40 S&P 500 points to borrow funds at current SOFR rates to go leveraged long the S&P 500. As the contract nears expiry, the price of the contract will converge to the underlying price. This is usually true of precious metals as well.
Charting futures
How does one create a long term chart for a market when the reference price, which is usually the front contract, changes every few months? The default methodology of charting only the front month results in large price gaps when the contract rolls from one to another, as shown in the chart of front month 10 year Treasury futures below.

This can be problematic when one is trying to figure out if a chart level has broken or not, or whether a chart pattern has completed. As a general rule, I prefer to use the chart for the month that I’m trading (Dec silver, or SIZ2024) when examining levels and patterns that have formed within the last 6 months when the contract has been liquid. When examining levels and patterns that go back farther than six months, I use the front month chart (SI! on Trading View and SI1 on Bloomberg).
There can be times when it’s useful to remove the gaps on charts that result from rolling contracts. A chart without these distortions illustrates what traders actually experienced in the market. Indicators such as stochastics and RSI may perceive gaps as large trending moves, therefore distorting the output of the indicators. Trading View provides instructions on how to remove these gaps by enabling back adjustment for continuous futures.
Disclaimer: The content of this blog is provided for informational and educational purposes only and should not be construed as professional financial advice, investment recommendations, or a solicitation to buy or sell any securities or instruments. The blog is not a trade signaling service and the author strongly discourages readers from following his trades without experience and doing research on those markets. The author of this blog is not a registered investment advisor or financial planner. The information presented on this blog is based on personal research and experience, and should not be considered as personalized investment advice. Any investment or trading decisions you make based on the content of this blog are at your own risk. Past performance is not indicative of future results. All investments carry the risk of loss, and there is no guarantee that any trade or strategy discussed in this blog will be profitable or suitable for your specific situation. The author of this blog disclaims any and all liability relating to any actions taken or not taken based on the content of this blog. The author of this blog is not responsible for any losses, damages, or liabilities that may arise from the use or misuse of the information provided.


