Conflicting signals
I just got back from a two week vacation and was reflecting on how crazy the past couple months of global macro have been. Fortunately my trading book stayed mostly square during the trip, because otherwise it would have been tough to enjoy the vacation given everything that has been going on.
One thing is clear - policymakers, not the economy, are moving the markets. Even if you had a crystal ball that told you every CPI print in advance, it wouldn’t have helped much unless you were also able to predict:
Liz Truss’s incoming government would unveil an inflationary deficit-widening fiscal stimulus plan that would result in a balance of payments crisis and a meltdown in GBP FX and gilts within a month.
The gilt market, one of the safest government bond markets in the world, would blow up thanks to margin calls on highly leveraged instruments called LDIs that are owned by pension funds. The BoE would have to bail them out by buying gilts and put QT on hold. This may be the first incident of bond market dysfunction and yield curve control by a G7 central bank in this tightening cycle.
The Nordstream natural gas pipeline from Russia to Europe would get sabotaged by a sophisticated and unknown entity, closing Europe’s escape route from its energy crisis and ensuring that Europe continues to support Ukraine in its war against Russia.
Jay Powell would unite the entire Fed board in its fight against inflation by cranking up the 2023 dot plot to 4.6%. I have never seen the Fed succeed to this extent in its messaging, and this is a rare moment in history where market pricing is now in line with the dot plot.
OPEC would slap Biden in the face by considering a cut to its output quota by 2 million barrels per day. The actual decrease in output would be much less than 2m bpd because many OPEC members can’t produce up to their quota anyway, but this is a clear signal that OPEC doesn’t want to see oil below $80.
Now let’s look ahead to what geopolitical landmines global macro traders have to contend with in coming months:
China’s CCP is holding its 20th National Party Congress on Oct 16. Xi will cement his 3rd term and the members of the Politburo Standing Committee (China’s top leadership body) will be chosen. We’ll also find out whether zero-covid policy will get relaxed, how China plans to deal with the real estate deleveraging crisis, and where things are going with Taiwan and US-China relations.
Ukraine’s advances in the war against Russia despite Putin’s mobilization of reserves portend an inflection point where Putin must either negotiate a truce or make good on the threat of using nukes. He can no longer Jedi mind-trick his people into believing that the “operation” in Ukraine is going smoothly - not when the sons of Russian mothers are getting drafted and reporting back the painful truth that Russia’s military is under equipped, poorly organized, and getting their asses kicked by a highly motivated and well-armed Ukrainian resistance. It has been a few months since this war has impacted global macro portfolios, but watch out for some big headlines in the next month that have the potential to (pardon the pun) nuke your portfolio.
Biden’s SPR releases are coming to an end and he needs to figure out how to refill it. There was an unconfirmed report last month that they would be buying oil below $80, but perhaps we will hear something more official about their strategy soon.
Newly elected Italian PM Giorgia Meloni is likely to enact some populist fiscal policies that will expand the fiscal deficit and stoke inflation. If she does, this may trigger a further blowout of the Italian BTP/German Bund spread and force the ECB to activate the Transmission Protection Instrument (TPI). This would be negative for European risk assets and euro FX.
In normal times, trading global macro is like playing 5-dimensional chess, which is hard enough. Today with the added variables of geopolitics and central bankers on a mission, we are playing 10-dimensional chess.
Moving on to the technical backdrop - There are signs this selloff in equities is reaching its limits. Here are a few charts:
AAII difference btwn bulls and bears touched then bounced back from levels that typically precede rallies
SentimenTrader publishes a Smart Money index and Dumb Money index and when the spread between the two goes above 50%, forward annualized returns are 55%. The spread has stayed up there for 6 consecutive days, and using the last 12 times this has happened since 2001 as a sample set, the forward returns has been consistently positive on a 2 week to 12 month time frame.
We also saw back-to-back days of positive breadth thrusts last week. SentimenTrader notes that this has a very positive track record on a two week to 12 month time frame.
Vanda notes how short equities to long USD has all been one big momentum trade, and that has gotten crowded.
We have seen a cluster of Demark 9s and 13s on the daily SPX futures chart. For those not familiar with Demark indicators, 9 and 13 counts tend to be found near turning points in the market.
I personally am not a fan of seasonal patterns, but for those who are, I have to mention that we are transitioning out of the worst seasonal period for the S&P 500 to the best three month period.
Everyone is bearish, and for good reason - the Fed has told everyone they want the stock market lower, consumers poorer, jobs less plentiful, and they will keep their thumb on the economy until inflation gets crushed. However, it is dangerous to overstay your welcome in the momentum trades that have been working because market is ripe for reversal and just needs a trigger. That trigger, I believe, will be when we see signs that the Fed is succeeding at inducing a recession. Yes you heard me - when the economic data starts to roll over and people start losing their jobs, the market will welcome it with open arms by staging a face-ripping rally.
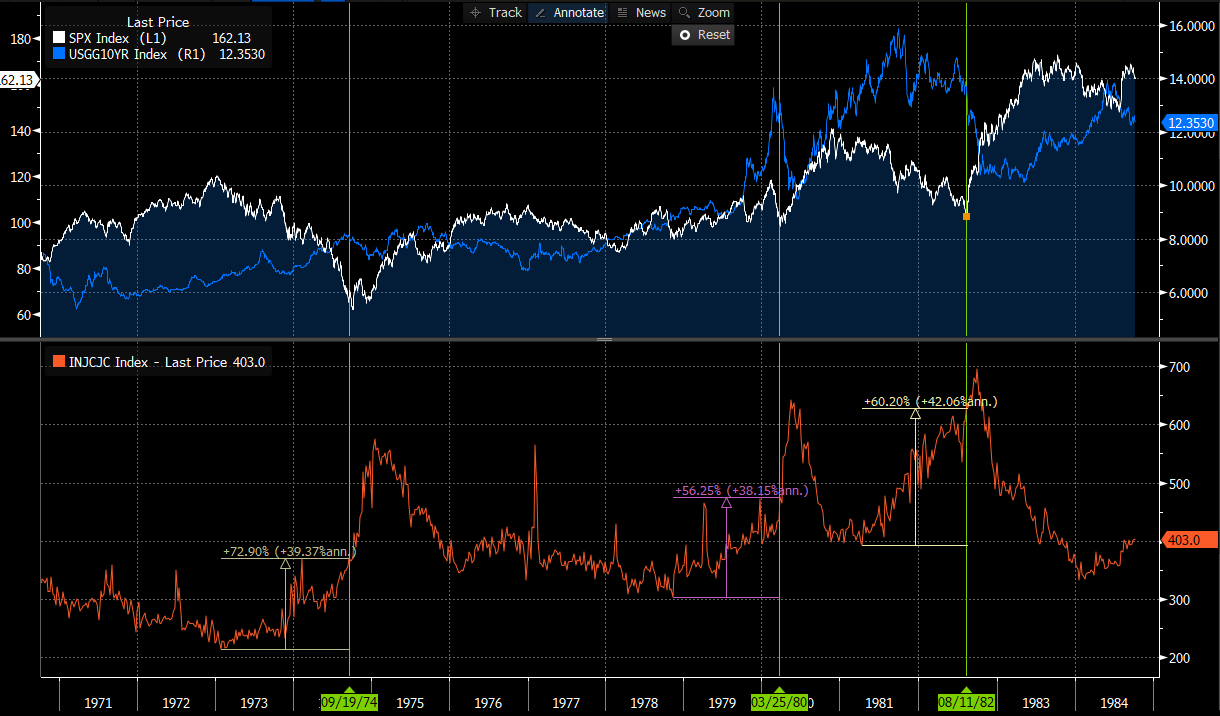
We saw a glimpse of this in the Jun-Aug rally, when the market kept reacting positively to lower than expected data. When the data started to surprise to the upside again, yields climbed back up, and guess what? The rally turned into a selloff. The fear of higher yields and Fed tightening is the #1 thing driving the market right now. This is a similar dynamic to the inflationary period of 1970-1985. When you look at a chart of 10 yr yields over the SPX during that period, every powerful rally in equities coincided with a local top in yields.
S&P 500 in white, 10 yr Treasury yields in blue. Green lines = local tops in yields.
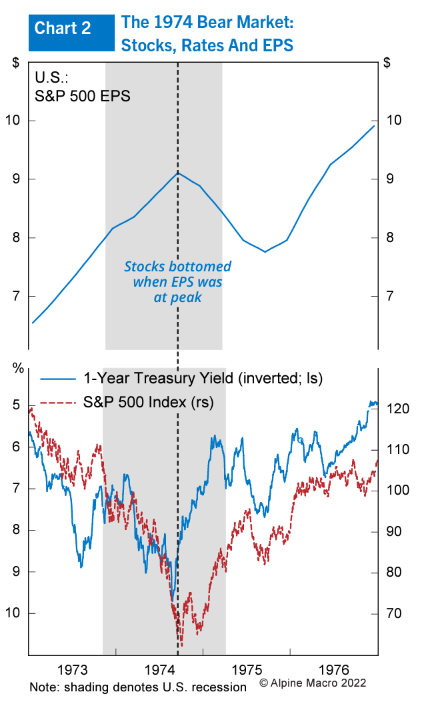
A case study by Alpine Macro of 1974 showing that the bottom in stocks coincided with the top in yields, while the earnings recession came in the following quarters.
Also consider this - right now equity earnings are being supported by hot nominal growth (9.6% nominal GDP growth, to be exact). When the earnings recession comes, it will be driven by declining nominal GDP and likely lower yields, both symptoms of the Fed winning the fight against inflation.
Here’s another fun fact - equity bull markets during the 70’s and 80’s tended to begin when jobless claims (in orange below) rose 55-75% from the trough. If we apply that rule to today, that would imply a target threshold of 258-291k in jobless claims. We were at 219k last week so we’re not that far away!
To sum it all up - 1) Policymakers rule the market 2) Be careful if you are riding the short stocks/long USD/short bonds momentum trade 3) Pray for a recession and job losses, just not your own or your friends!
Disclaimer:
The content of this blog is provided for informational and educational purposes only and should not be construed as professional financial advice, investment recommendations, or a solicitation to buy or sell any securities or instruments.
The author of this blog is not a registered investment advisor, financial planner, or tax professional. The information presented on this blog is based on personal research and experience, and should not be considered as personalized investment advice. Any investment or trading decisions you make based on the content of this blog are at your own risk.
Past performance is not indicative of future results. All investments carry the risk of loss, and there is no guarantee that any trade or strategy discussed in this blog will be profitable or suitable for your specific situation. The author of this blog disclaims any and all liability relating to any actions taken or not taken based on the content of this blog. The author of this blog is not responsible for any losses, damages, or liabilities that may arise from the use or misuse of the information provided.


