Some of you have told me you’re not getting every blog post in your email inbox. If you are experiencing this, please check your spam folder and add substack.com as a safe domain. You can also download the Substack app, and from there you can get a mobile notification and read my post directly on the app every time my blog is published.
In addition, I will be traveling for the next few weeks so I might not be able to post while I’m on vacation.
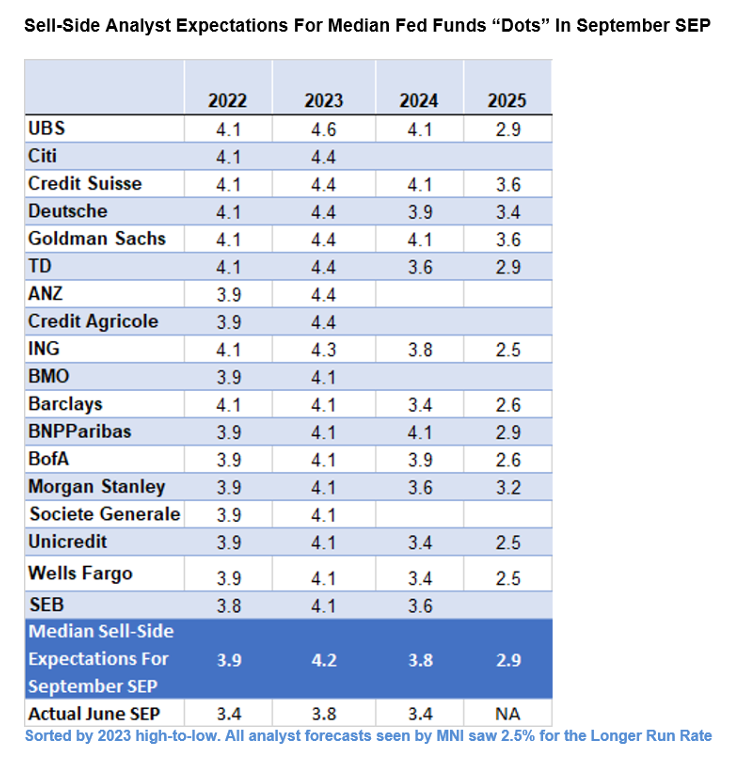
We have the Federal Reserve Open Market Committee tomorrow and it’s hard to find anyone who’s not bearish the market and betting on continued hawkishness. By observing the reaction to last week’s stronger than expected CPI, one would have thought inflation was surging to new highs above 9%. We now have the market pricing a 20% probability of a 100 bp hike (vs 75 bp), while sell-side estimates of the dot plot point to 3.9-4.1% by Dec 2022 and 4.1-4.4% by Dec 2023.
Courtesy of MNI
The Fed funds curve predicts the Fed hiking to 4.22% by Dec, which means either the dot plot has to exceed sell-side expectations or the Fed has to surprise the market by hiking 100 bp.
I believe it’s unlike the Fed can out-hawk the market because the Fed, by hiking to 3.25% and above, sees itself entering “restrictive territory” where tightening would cause a recession and some financial market volatility. They are watching data come in soft, signaling a growth slowdown and a decline in CPI (a lagging indicator) down the road. I’m betting that further hawkish shifts from this point onward will be incremental, and not large jumps like we saw earlier this year. I have no doubt that Powell will do his best to sound hawkish tomorrow, but the market has the tendency to latch onto random comments and twist them into dovish conclusions. Something like “We are seeing economic data soften” or “There are signs of easing price pressures” (both of which are factual) could elicit a retracement in the market hawkish pricing and bearish positioning.
What does this mean for the market? Well, we are certainly at an inflection point, and this means choppy, indecisive markets. We are in a similar (but not as extreme) scenario as June 14 , when an overshoot of Fed hiking expectations, coupled with an excessively bearish and short equity market resulted in a two month rally in the S&P 500.
Ultimately it comes down to the path of inflation. I’ve been an inflation hawk for as long I’ve been writing this blog, but lately the data supporting the peak inflation narrative has been getting broader and more compelling. The first two charts below (from Goldman and Alpine Macro) attempt to break down how much inflation comes from supply constraints and how much comes from the demand side of the economy. They argue that demand-driven inflation has already declined, while supply-driven inflation is in the process of rolling over. The third chart by Capital Economics shows how a PPI index of consumer services leads the Fed’s PCE inflation index and is undergoing a sharp decline.
Those who point to higher inflation ahead can say that the labor market is still very tight and wage growth is still quite high (but losing momentum). One can also point to the 70’s and 80’s and argue that you need interest rates above the level of CPI to bring inflation down. There are plenty of arguments for and against peak inflation, and therefore this is a time to be nimble in positioning and not go all-in on one view. Due to some upcoming travel, I personally will be holding very little risk into the Fed meeting - just my commodity ETF portfolio, and maybe long silver.
For those betting on a reversal of equity weakness and USD strength, here are a view chart-based trade ideas.
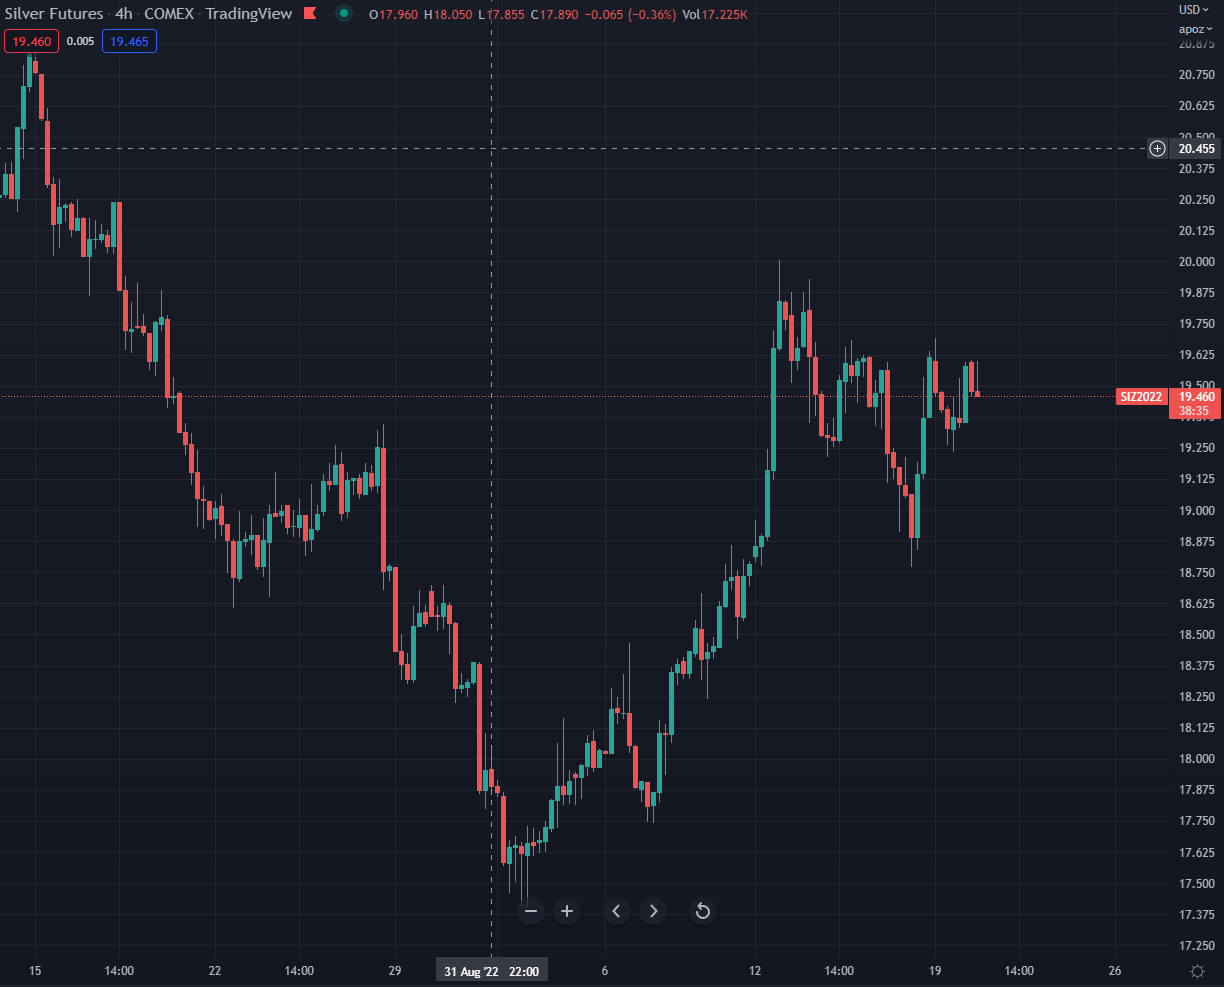
Silver has been ripping since Sept 1 and barely pulled back on the strong CPI number on Sep 15. I don’t know why it’s so bid relative to gold, equities, and other high beta assets, but being long could be an asymmetric bet on a risk rally and USD selloff.
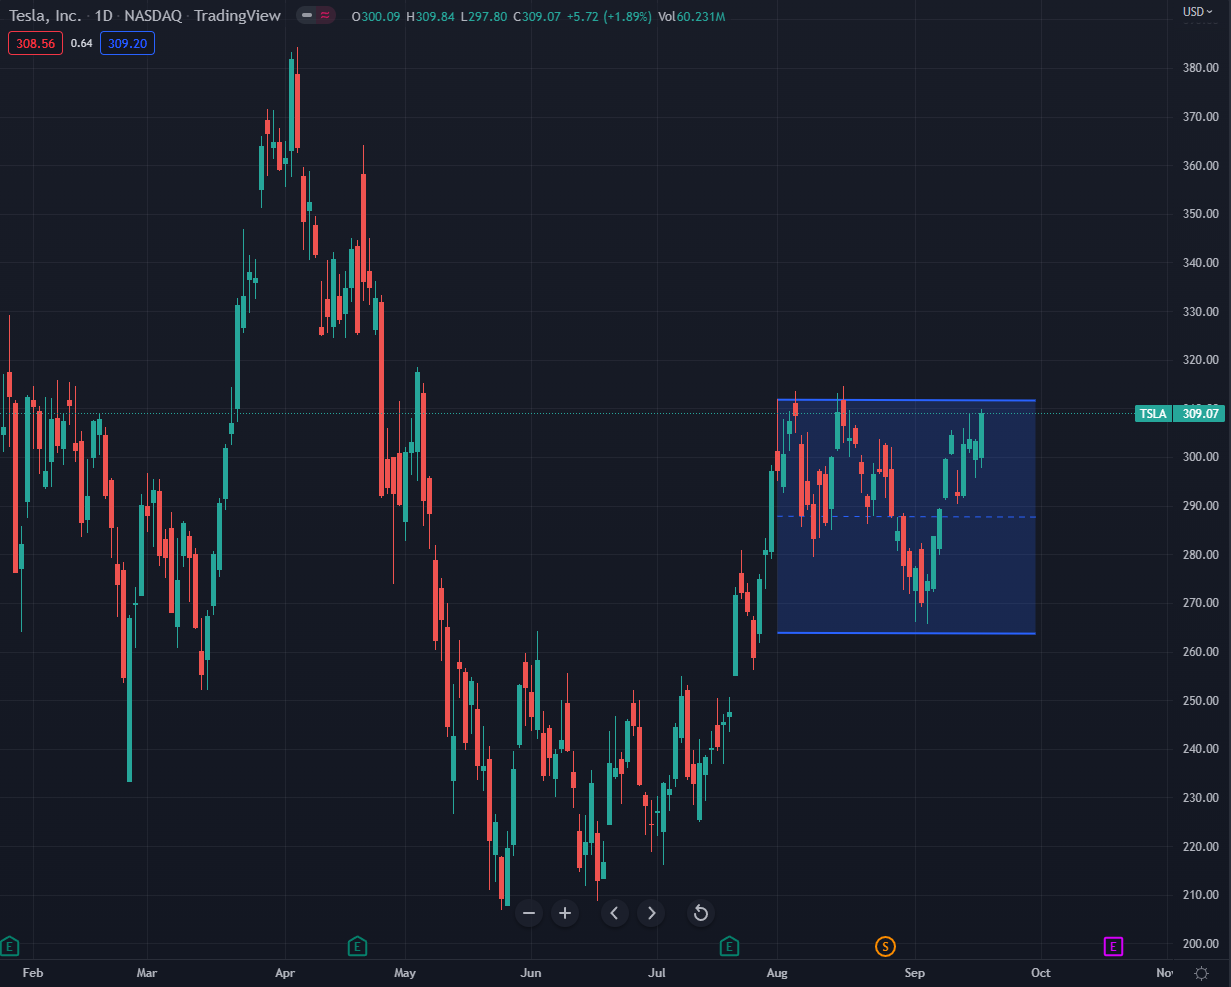
If you look at the charts of S&P leaders like Apple, Google, Microsoft, etc they have all gotten hammered since mid-Aug. Except Tesla. Tesla is holding in like a rock, and any recovery in the broader index could result in some explosive upside. The breakout level is 315.
Netflix was a covid beneficiary that took its medicine earlier in the bear market, and it’s now forming a nice base. It has barely taken a hit since mid-Aug, and a break through 250 alongside a broader risk recovery could signal the start of a new uptrend.
Just to caveat - I’m not looking at the fundamentals of TSLA and NFLX, and am just focusing on the charts and price action. Good luck this week!
Disclaimer:
The content of this blog is provided for informational and educational purposes only and should not be construed as professional financial advice, investment recommendations, or a solicitation to buy or sell any securities or instruments.
The author of this blog is not a registered investment advisor, financial planner, or tax professional. The information presented on this blog is based on personal research and experience, and should not be considered as personalized investment advice. Any investment or trading decisions you make based on the content of this blog are at your own risk.
Past performance is not indicative of future results. All investments carry the risk of loss, and there is no guarantee that any trade or strategy discussed in this blog will be profitable or suitable for your specific situation. The author of this blog disclaims any and all liability relating to any actions taken or not taken based on the content of this blog. The author of this blog is not responsible for any losses, damages, or liabilities that may arise from the use or misuse of the information provided.


